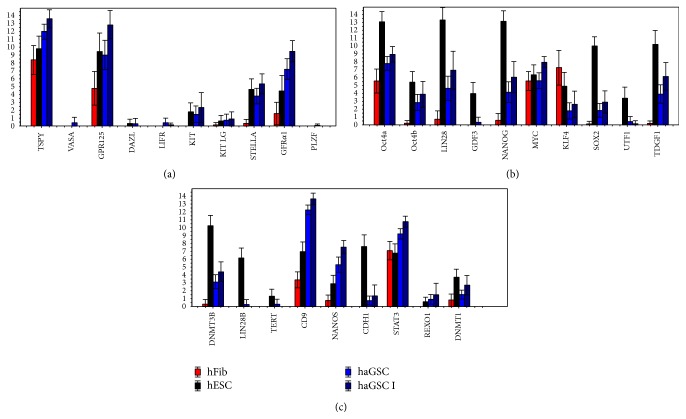
Figure 3.
Bar plot showing relative expressions of (a) germ- and (b, c) pluripotency-associated genes between haGSCs (coloured light blue), haGSC I (coloured dark blue), hESCs (coloured black), and hFibs (coloured red). For P < 0.05 haGSCs versus hFibs and P < 0.05 haGSC I versus hFibs, see Supplementary Table 3.

