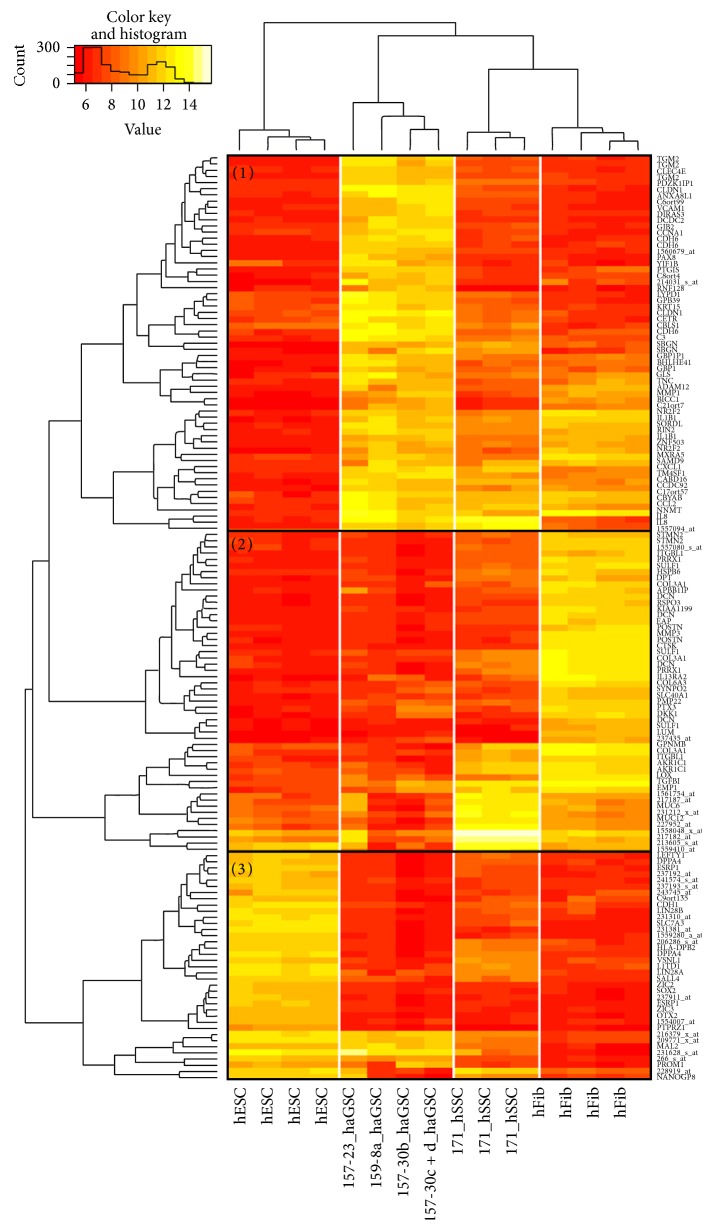
Figure 5.
Heatmap of 150 features with the highest variance generated by independent clustering of genes and samples using complete linkage clustering and Euclidean distance. All cell types were separated consistently and grouped correctly into subtrees. Each cell type was characterized by a specific set of highly expressed genes (block pattern). The set of high variance genes could be grouped in 3 classes of genes with high expression: (1) in hESCs (H1), (2) in hFibs, and (3) in haGSCs.

