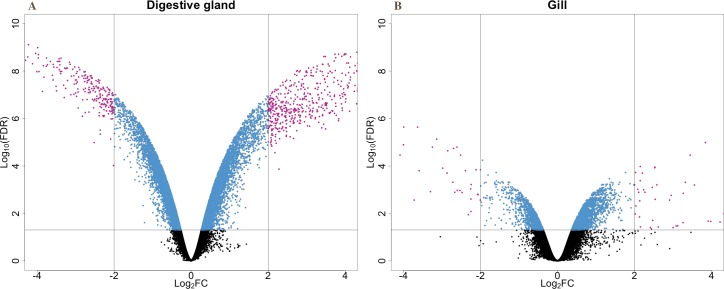
Figure 2. V-plots showing gene expression differences detected through microarray analysis in digestive gland (A) and gill (B) tissues.
These differences are represented as net expression change (logFC) with statistical significance (FDR) indicated as a logarithmic scale. Probes highlighted in blue (FDR < 0.05) and purple (FDR < 0.05 and logFC > 2) represent the groups of transcripts displaying largest changes in gene expression between exposed and control treatments.

