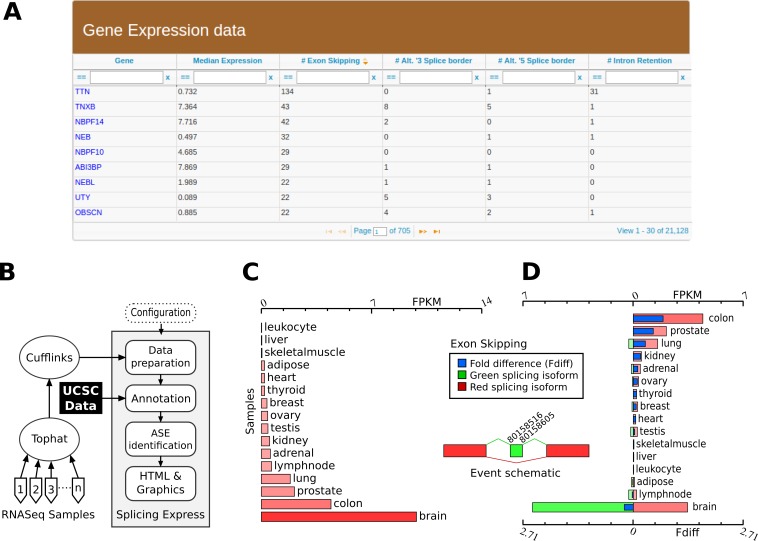
Figure 1. Overview of Splicing Express features.
(A) Table generated by Splicing Express showing expression level and number of variants in a gene-by-gene basis. (B) Schematic representation of the computational pipeline used by Splicing Express. (C) Graphic represention of the expression pattern of NRXN3. (D) Graphic represention of the differential expression of one isoform (exon skipping) of NRXN3. The exon skipping isoform is represented in red, while the isoform including the respective exon is colored in green.

