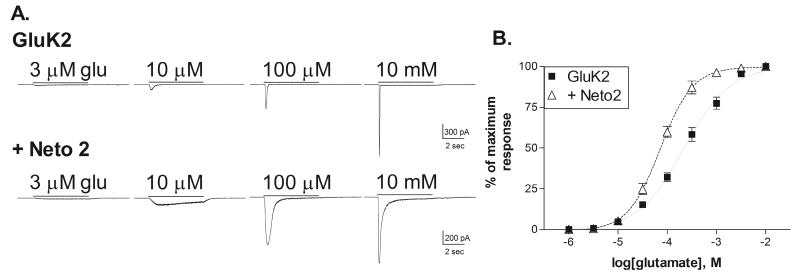
Figure 3. Effect of Neto2 on the glutamate sensitivity of GluK2 homomeric receptors.
A. Representative current traces from HEK-293T cells transiently transfected with GluK2 alone, or GluK2+Neto2. Cells were voltage-clamped at −70 mV in the whole-cell configuration. Glutamate was applied for 5 sec (solid bar) at the concentration indicated. For each subunit combination, all traces shown were obtained from the same cell.
B. Glutamate concentration-response relationships were constructed by normalizing the peak amplitude of the current response to the maximum response to saturating agonist levels for each cell. Symbols represent mean ± SEM. Averaged data was fit with a sigmoidal curve (solid or dashed lines). The glutamate EC50s for the fits shown were 218.2 μM (GluK2, n=5) and 72.5 μM (+Neto2, n=6).

