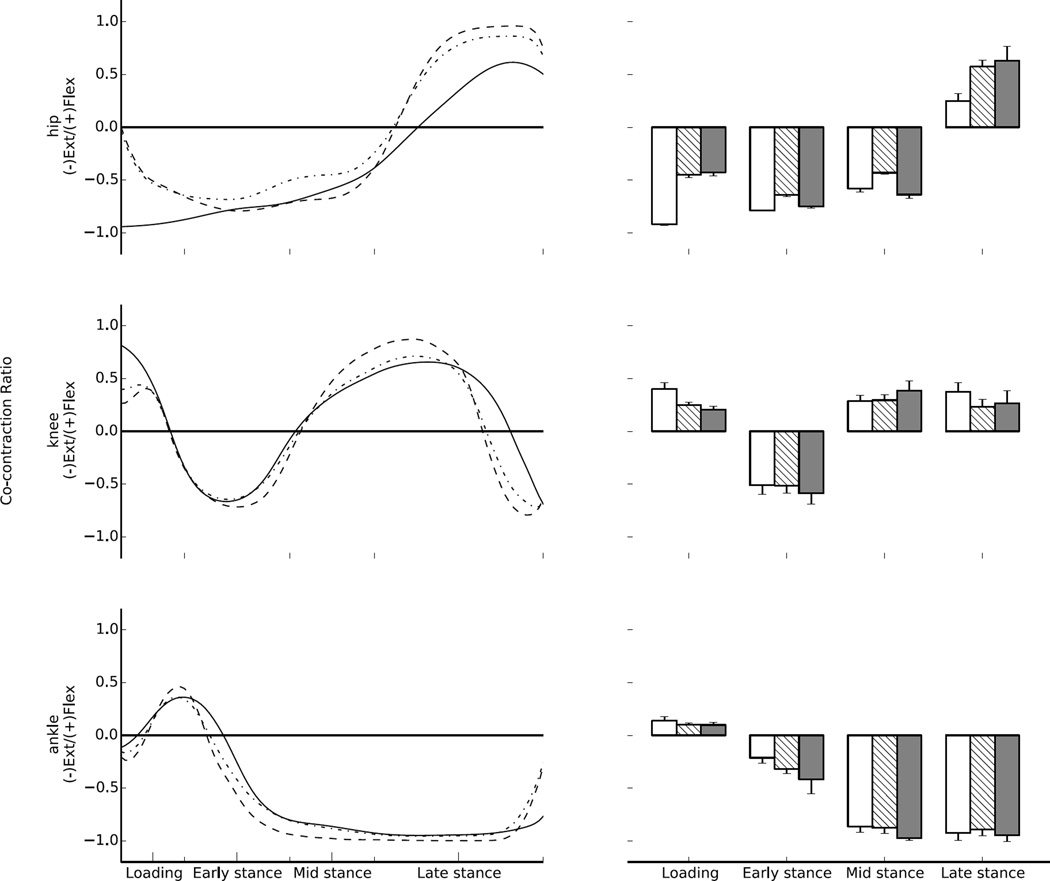
Figure 8.
Effective mechanical co-contraction ratios between flexion and extension muscle moments at the hip, knee, and ankle of 30 walking trials from 5 different individuals. Zero represents maximum co-contraction, and 1 or −1 minimum co-contraction. On the left data is presented as mean time series for EMG-driven (solid), EMG-assisted (dash-point), and static optimisation (dashed) modes. On the right mean (1 SD) on co-contraction ratios of the muscle moments for each stage of stance, for EMG-driven (white), EMG-assisted (crosshatch), and static optimisation (grey). Loading first 15% of stance, early stance from 15% to 40%of stance, mid stance from 40% to 60% of stance, late stance from 60% to 100% of stance.

