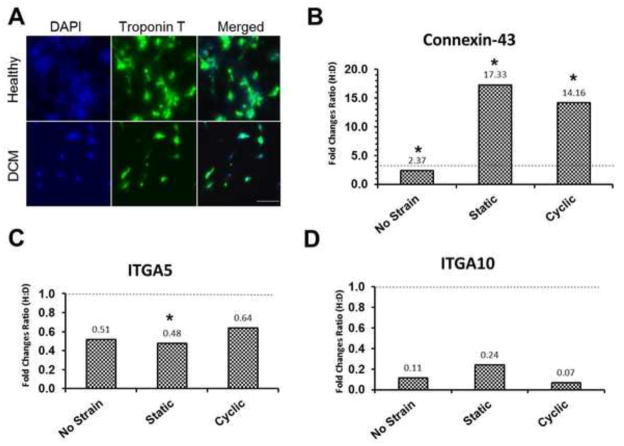
Figure 4.
Cell-cell interaction of healthy iPSC-CMs was increased by mechanical stimulation. (A) Immunofluorescence images of cardiac Troponin T expression in healthy and DCM iPSC-CMs under 5% static condition. Gene expression ratios (Healthy: Disease=H:D) of (B) connexin 43, (C) integrin alpha 5 (ITGA5), and integrin alpha 10 (ITGA10) in iPSC-CMs under each condition. Fold changes normalized by GAPDH. * p<0.05, comparison between healthy iPSC-CMs and DCM iPSC-CMs under the same mechanical stimulation. Scale bar = 200 μm. Dashed line at a fold change ratio of 1 in all plots.

