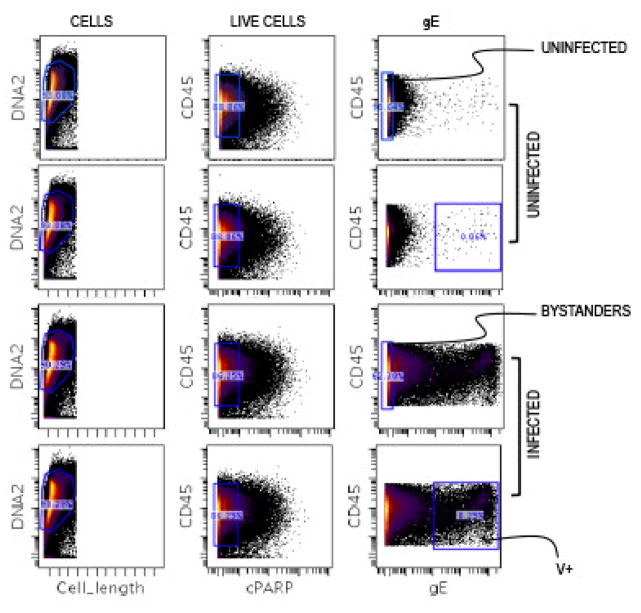
Fig. 1. Gating Scheme.
Normalized data collected on the mass cytometer was transferred to www.cytobank.org. The T cells were consequently sequentially gated for DNA content to identify nucleated cells, and viability markers to extract uninfected (UI), bystander (Bys) and VZV-infected (V+) populations for downstream analysis. The UI cells chosen for comparative analysis were matched to be on the co-ordinates as the Bys cells from the VZV-infected sample (containing both Bys and V+ cells).

