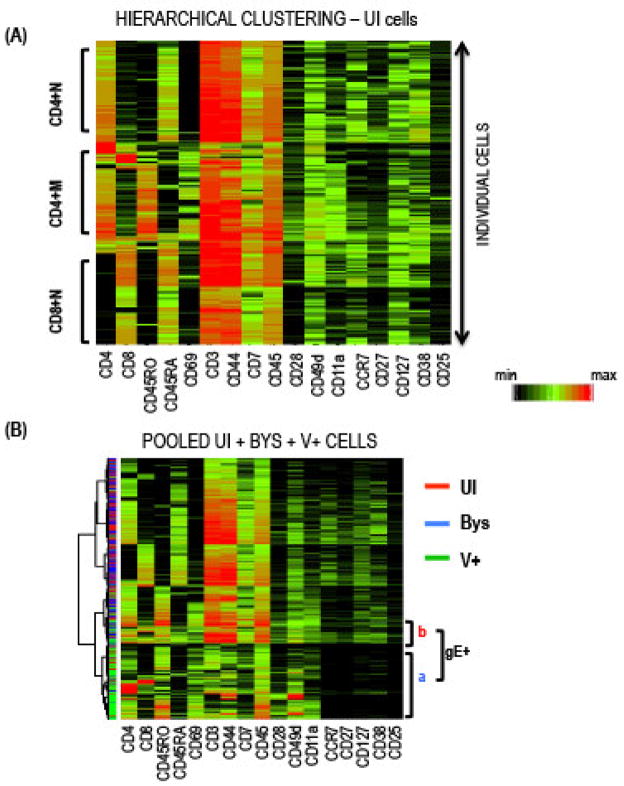
Fig. 3. Agglomerative Hierarchical Clustering.
(A) Heatmap displaying the hierarchical clustering of UI T cells; each row of the heatmap represents a cell and each column the indicated protein; the color scale indicates protein expression levels from minimum (black) to maximum for each protein. Dendrograms on the left denote the Euclidean distance between the clustered cells. (B) Hierarchical relationship of pooled UI, Bys, and V+ T cells based on surface proteins by PCA (left) and agglomerative clustering (right). A majority of the V+ cells clustered together on the heatmap distinct from the overlapping UI and Bys cells indicated by the red and blue lines, respectively, shown on the left of the heatmap.

