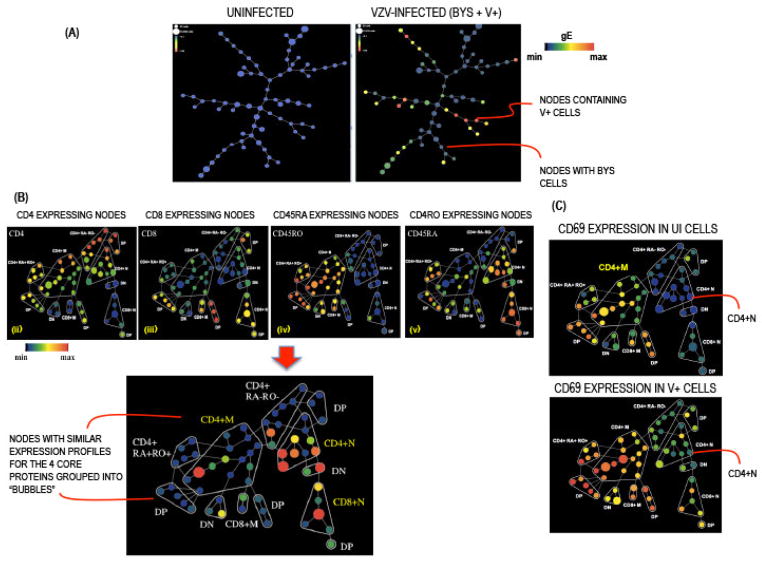
Fig. 4. Spanning Tree Progression Analysis of Density Normalization Events.
(A) SPADE tree from a representative experiment in which the UI (left panel) and VZV-infected (unseparated Bys and V+ T cells; right panel) T cells were distributed into 50 nodes based on expression of the four core markers CD4, CD8, CD45RO and CD45RA; each node denotes a collection of cells with a similar profile placed in proximity to nodes with closely related profiles. The size of the nodes is directly proportional to the number cells in that node. The color of the nodes from blue (minimum) to red (maximum) denotes increasing median intensity of gE expression in UI and VZV-infected samples. (B) The nodes on the SPADE trees were annotated into subpopulations based on the expression of CD4, CD8, CD45RO and CD45RA as shown in respective panels; DP = double positive (CD4+CD8+), DN = double negative (CD4−CD8−). (C) SPADE trees showing the differential expression of CD69 on UI and V+ T cells across phenotypic hierarchies.

