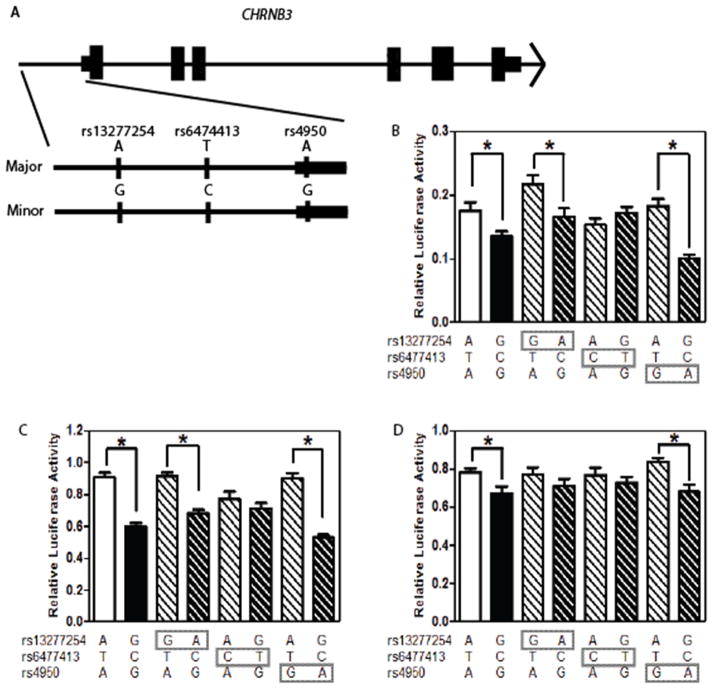
Fig. 1.
SNPs upstream of CHRNB3 influence gene expression. (A) represents a graphical depiction of SNPs tested and corresponding location to the CHRNB3 gene. Briefly, our construct contained a 2,987bp fragment cloned from the region upstream of the CHRNB3 including the 5′UTR. The expanded region labeled major and minor depicts the 2,987bp fragment and location of 3 SNPs examined and allele present on the major and minor parent constructs. The effect of the genotype at rs13277254, rs6474413, and rs4950 on reporter gene expression was examined in three cell lines (B) BE(2)-C, (C) SH-SY5Y, and (D) HEK293T cells. The genotype at each SNP is depicted below the graph. The open white and closed black bars represent the major and minor parent constructs, respectively. Data (mean ± SEM) relative gene expression. * p <0.05

