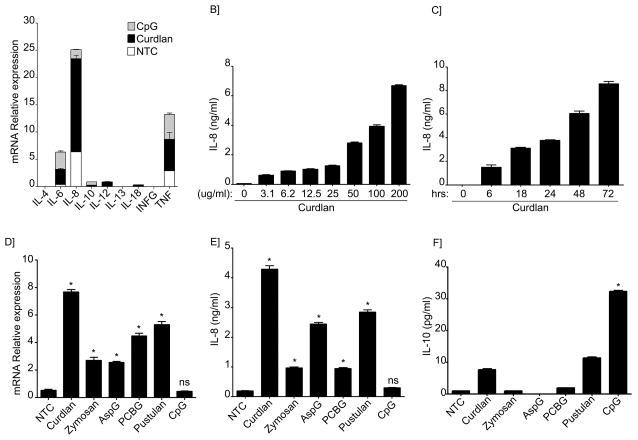
Figure 1. Cytokine profile from β-glucan stimulated human peripheral B-lymphocytes differs from CpG stimulated cells.
(A) Quantitative real-time PCR for indicated mRNAs in non-treated cells (NTC) or B-cells stimulated with CpG or Curdlan. Stacked bars represent the relative expression of the cytokines tested after specific stimuli of B-lymphocytes as indicated. Segments of each bar are not additive. Expression was normalized to GAPDH. (B) IL-8 was measured by ELISA in the cell supernatant after Curdlan stimulation at the indicated concentrations or (C) after stimulation with Curdlan for the indicated period of time. (D) Quantitative real-time PCR for IL-8 mRNAs in NTC or B-cells stimulated with the different β-glucan preparations or CpG. Expression was normalized to GAPDH. (E) IL-8 and (F) IL-10 were measured by ELISA in the supernatants of NTC, after stimulation with different β-glucan preparations or CpG as indicated. Shown are data from a representative experimental run, typical of at least three separate experimental preparations, performed with different B-cell preparations. *p<0.0001 when compared with the NTC.

