Figure 1.
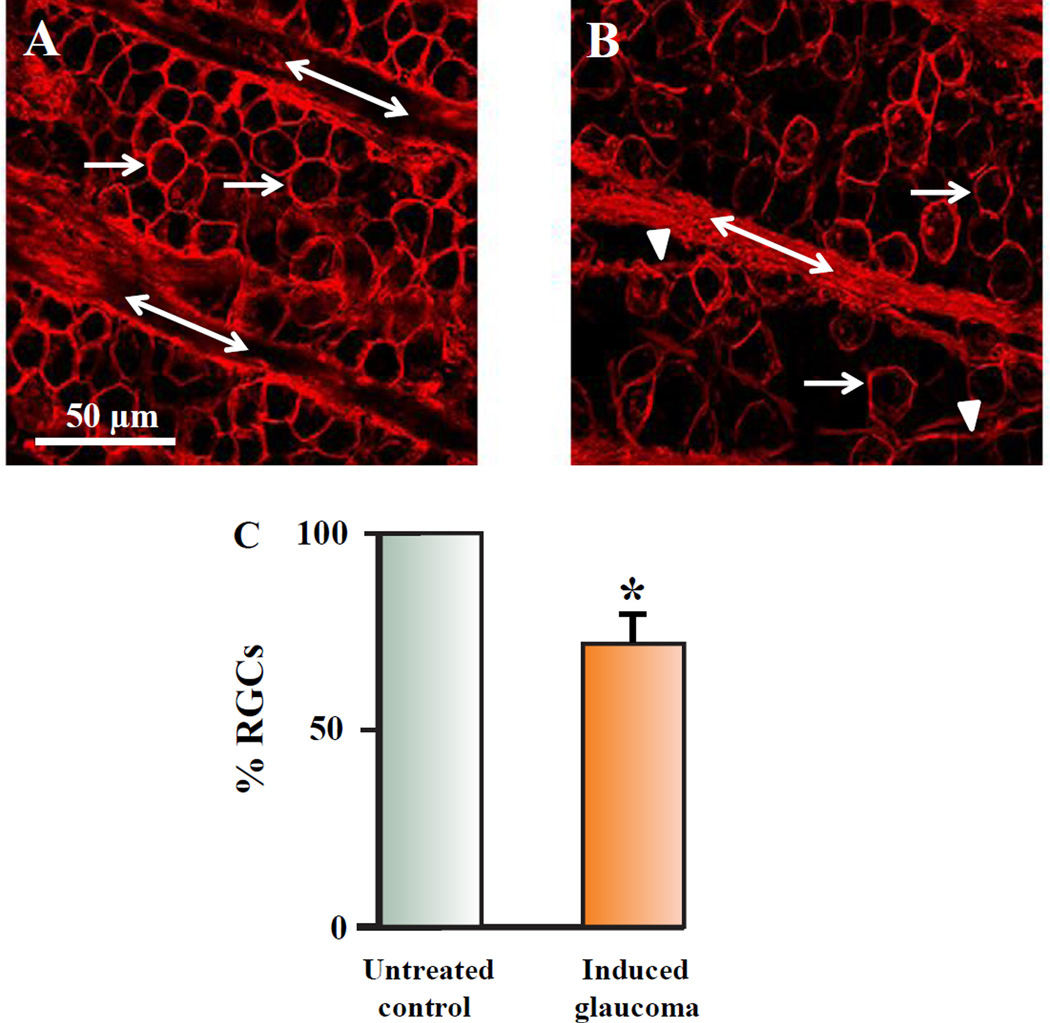
Effects of glaucoma in the nerve fiber layer and RGC layer. 1A represents a confocal image obtained from an adult Long Evans rat retina that was labeled with an antibody against Thy 1.1 4 mm from the ONH in control untreated conditions. The arrows point to RGC soma, while the double arrows demonstrate the axon fascicles in the nerve fiber layer. 1B illustrates an image obtained from the same rat, from the same retinal geographic location in an eye injected with 2 M NaCl in the episcleral veins. The image shown was obtained one month after the procedure to induce glaucoma-like conditions. The arrow heads point to axon strands defasciculating from the main axon bundles. Figure 1C demonstrate bar graphs that plot the average loss of RGCs associated with the procedure to induce glaucoma-like conditions after one month. The star represents significant differences from the control untreated condition. Error bars represent S.E.

