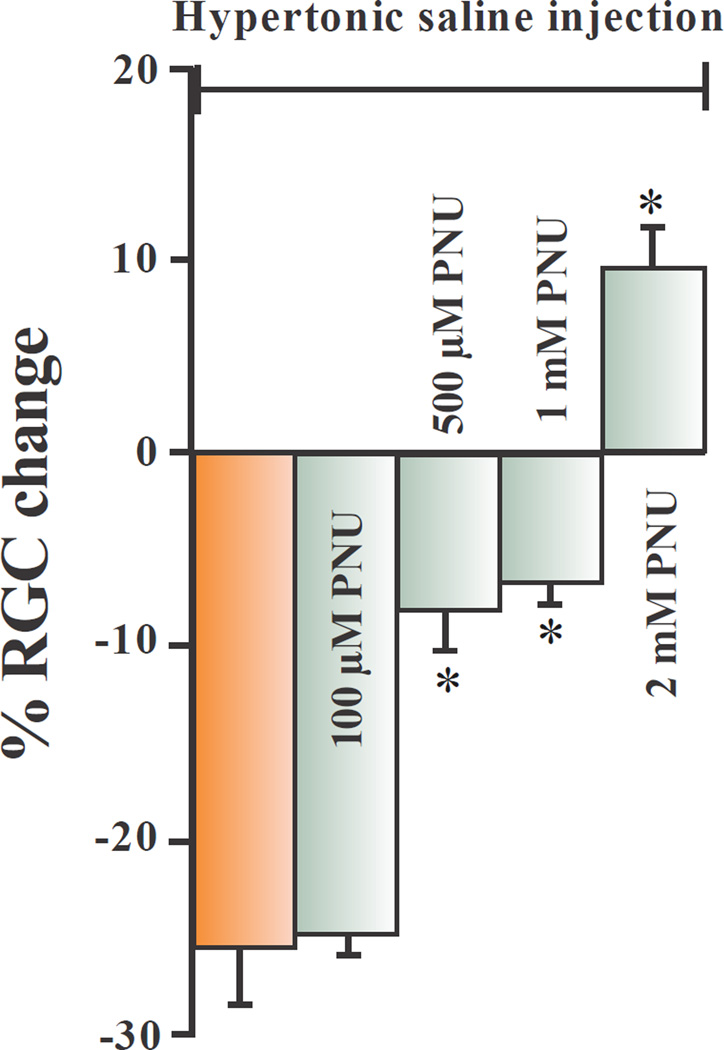
Figure 4.
Dose response neuroprotection with PNU-282987. This bar graph summarizes the dose-dependent effect of PNU-282987 on RGC survival after the procedure to induce glaucoma-like conditions. The brown bar graph represents the average percent loss of RGCs that occurred one month after hypertonic injections into the episcleral veins. Each green bar graph represents the average effect of experimental retinas treated with different concentrations of PNU-282987 as eye drops before and after the procedure to induce glaucoma-like conditions. The * represents significant neuroprotection from RGC loss associated with inducing glaucoma-like conditions. Error bars represent S.E.

