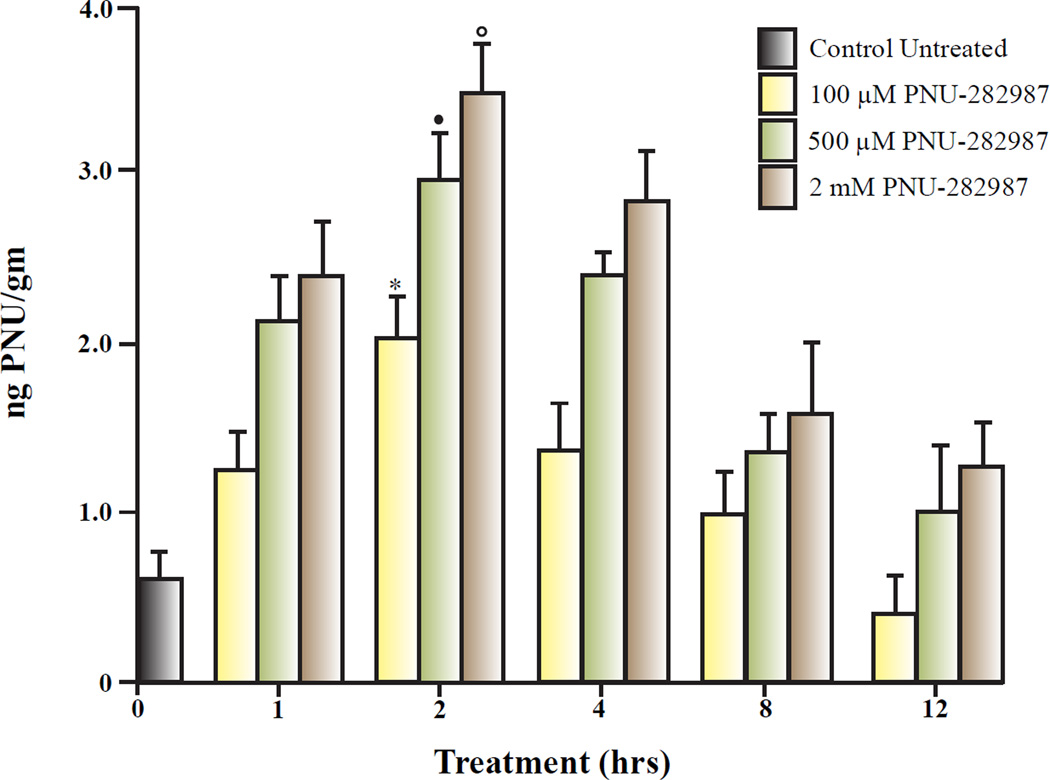
Figure 6.
LC/MS/MS analysis of PNU-282987 applied as eye drops. Each bar graph represents the average ng PNU-282987 per gram of animal weight measured from isolated retinas treated with various concentrations of PNU-282987. Different concentrations of PNU-282987 were applied directly to rat eyes and then sacrificed from 0 – 12 hours. At different time points, the treated retinas were removed and processed for PNU-282987 detection using LC/MS/MS analysis at the Western Michigan Innovation Center. The * represents significant difference from all other time points when 100 µM PNU-282987 was applied as eye drops. The closed circle represents significant difference from all other time points when 500 µM PNU-282987 was applied as eye drops and the open circle represents significant difference from all other time points when 2 mM PNU-282987 was applied as eye drops. Error bars represent S.E.

