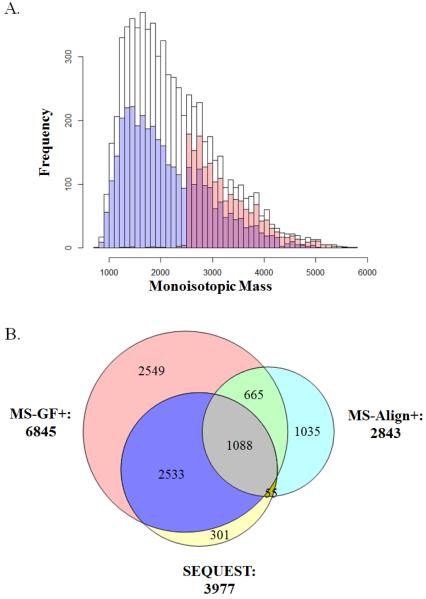
Figure 1.
Comparison of the peptidome peptide identification results from MS-GF+, SEQUEST and MS-Align+. (A) Distribution of precursor monoisotopic mass for MS-GF+ (white), SEQUEST (blue) and MS-Align+ (red). (B) Venn diagram showing the overlap of the identifications resulted from MS-GF+ (red), SEQUEST (yellow) and MS-Align+ (blue) analyses.

