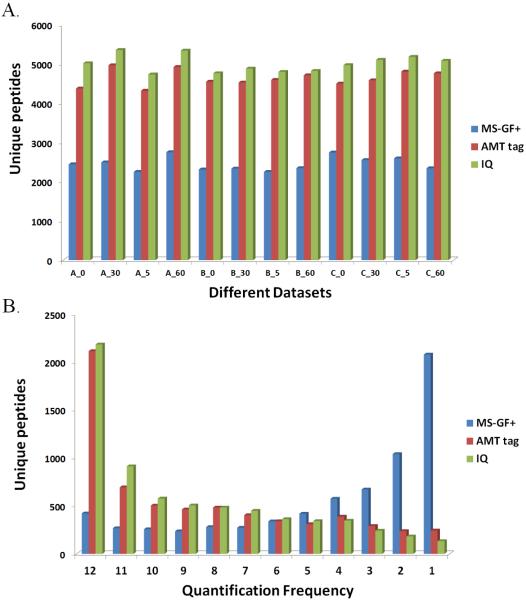
Figure 2.
Comparison of identification and quantification results from MS-GF+, AMT tag and IQ analyses. (A) Comparison of number of identified unique peptides in each sample for MS-GF+ (blue), AMT (red) and IQ (green). (B) Distribution of quantification frequency among all samples for MS-GF+ (blue), AMT tag (red) and IQ (green).

