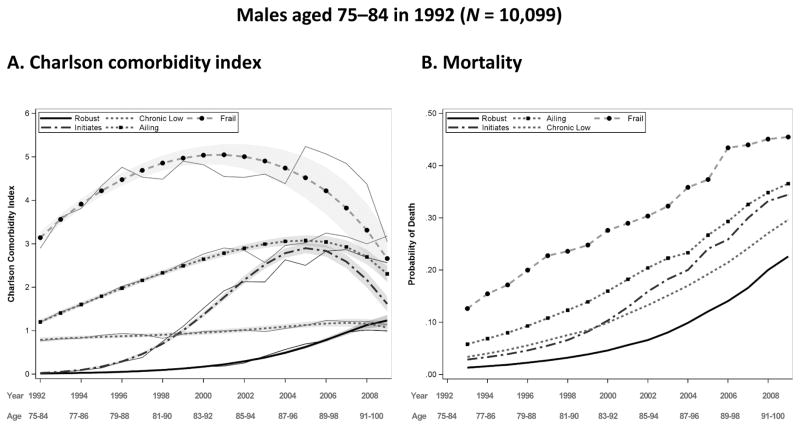
Fig. 5.
Predicted and observed Charlson comorbidity index (CCI) by year and group for males aged 75–84 in 1992, with a 95 % confidence intervals displayed by gray shading (panel A), and predicted probability of death before the next year by group for males aged 75–84 in 1992 (panel B). Source: Utah Population Database and Centers for Medicare & Medicaid Services (CMS) data

