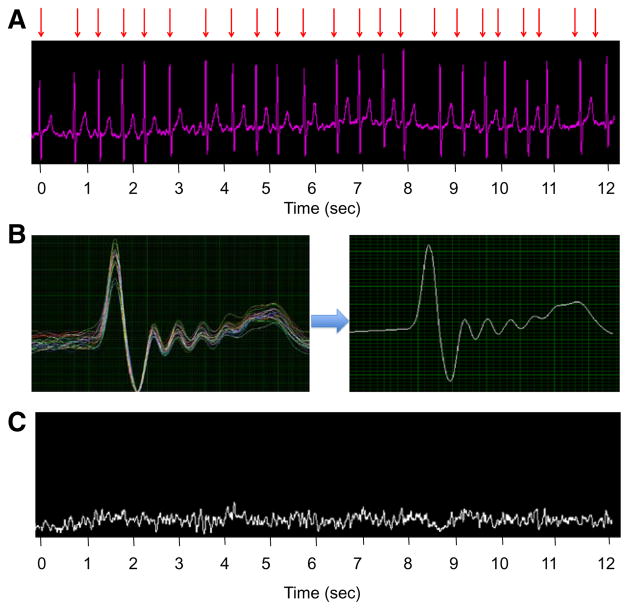
Figure 3.
Quantitative analysis of atrial unipolar electrograms. A, Raw unipolar signal from single electrode on a basket catheter, with red arrows indicating QRS complexes to be filtered out. B, QRS waveforms are plotted simultaneously to create an aggregated QRS–T complex. C, Remainder signal after QRS–T subtraction shows pure atrial electric activity.

