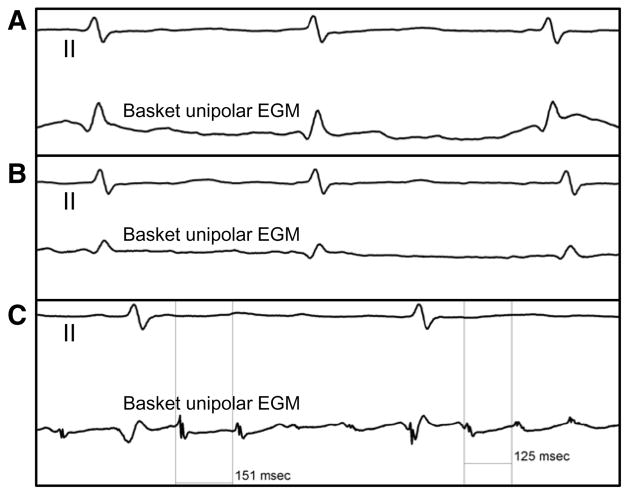
Figure 6.
Atrial electrogram analysis: local activation time. A, Top, Surface ECG lead II. Bottom, Local electrogram (EGM) from a rotor site recorded by using a basket catheter. Only ventricular activation can be seen on the local tracing. B, On this unipolar recording with a voltage of 0.06 mV, low-amplitude atrial EGM can be seen, but activation time cannot be accurately annotated. C, On this unipolar recording with a voltage of 0.28 mV, atrial EGM is decipherable and shows variable cycle length.

