Figure 2.

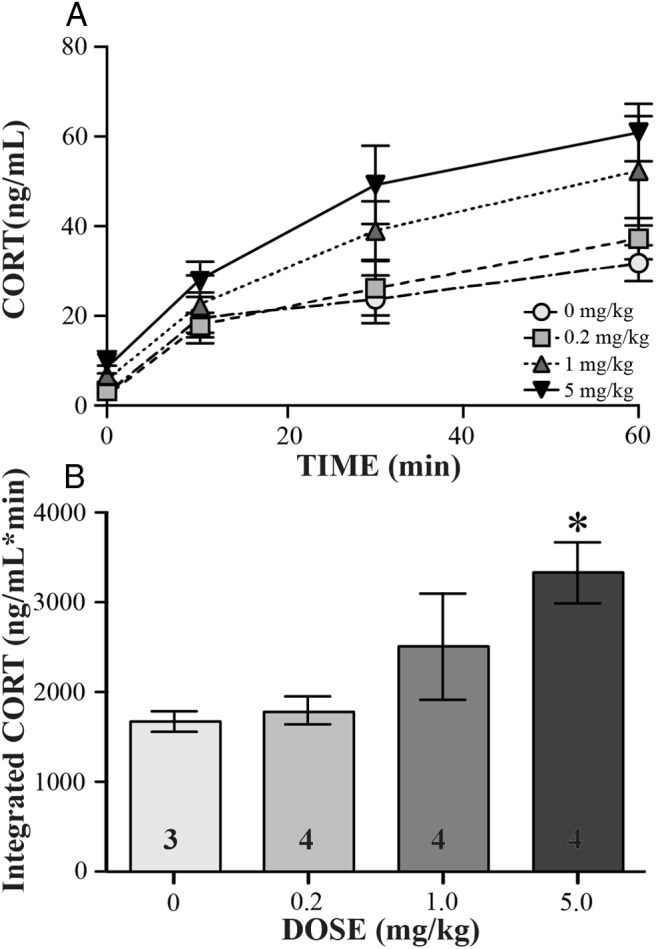
Dose-response curve for CB1 antagonist, AM251. Data are indicated as mean ± SE. Across bleed times (A) and as total (B), integrated CORT released during sampling period is shown. In panel B, the asterisk indicates significance as determined by a post hoc Dunnett's test (P < .05), and sample sizes are indicated as numbers within the bars.
