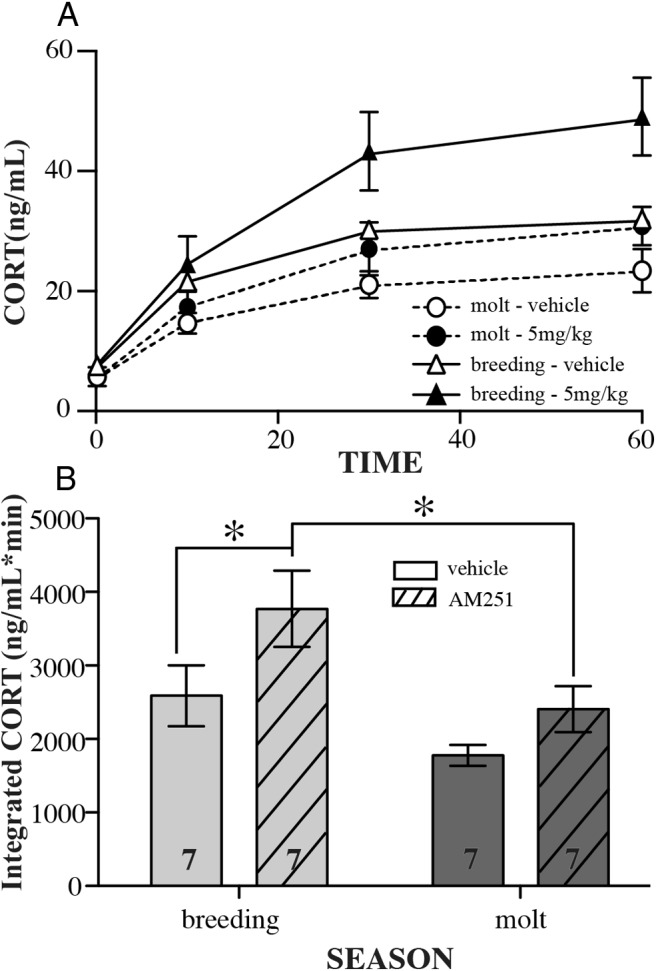
Figure 3.

Seasonal responses (late breeding vs molt) to CB1 antagonist injection. Data are indicated as mean ± SE. Across bleed times (A) and as total (B), integrated CORT released during sampling period is shown. Data represent repeated measures between seasons because the same individuals were given the same injection dose during both breeding and molt. Open columns represent vehicle-injected birds, whereas hashed columns represent antagonist AM251-injected birds. In panel B, asterisks indicate significance as determined by a post hoc Bonferroni test (P < .05), and sample sizes are indicated as numbers within the columns.
