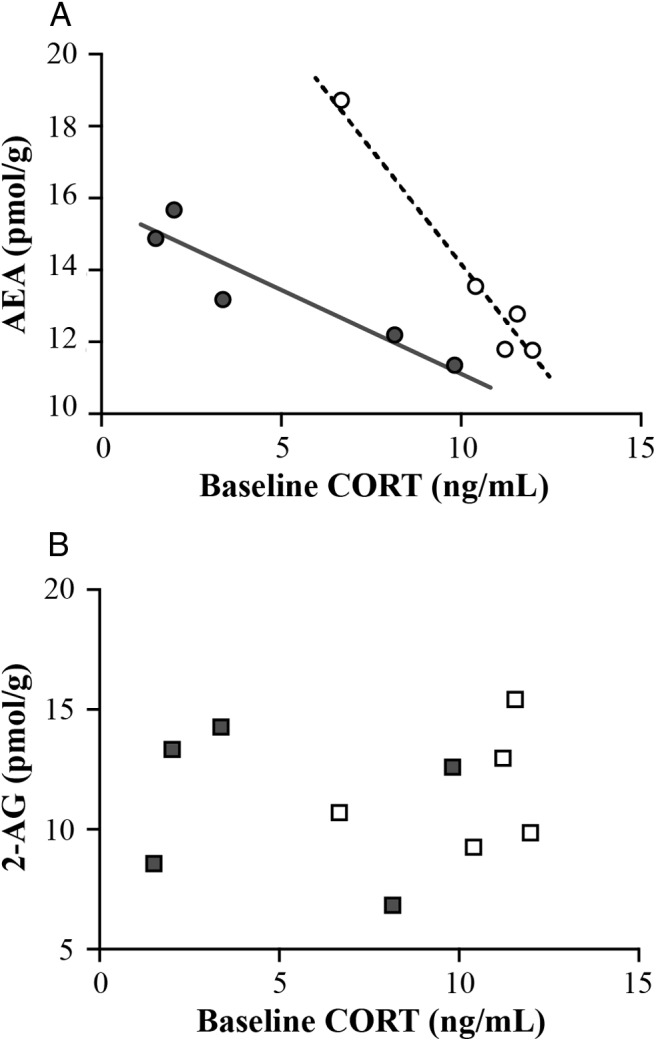
Figure 5.

Changes in baseline tissue content in the amygdala vs baseline CORT concentrations. Individual data points exhibited a significantly negative correlation between baseline CORT and AEA (R2 = 0.937 P < .0005) that was driven by season (t = −6.53, P = .0006) and CORT (t = −9.44, P < .0001) A) with a significant season CORT interaction (t = 4.70, P = .003). B, Baseline CORT vs 2-AG. Open shapes represent individuals during breeding season, whereas closed shapes represent individuals during molt.
