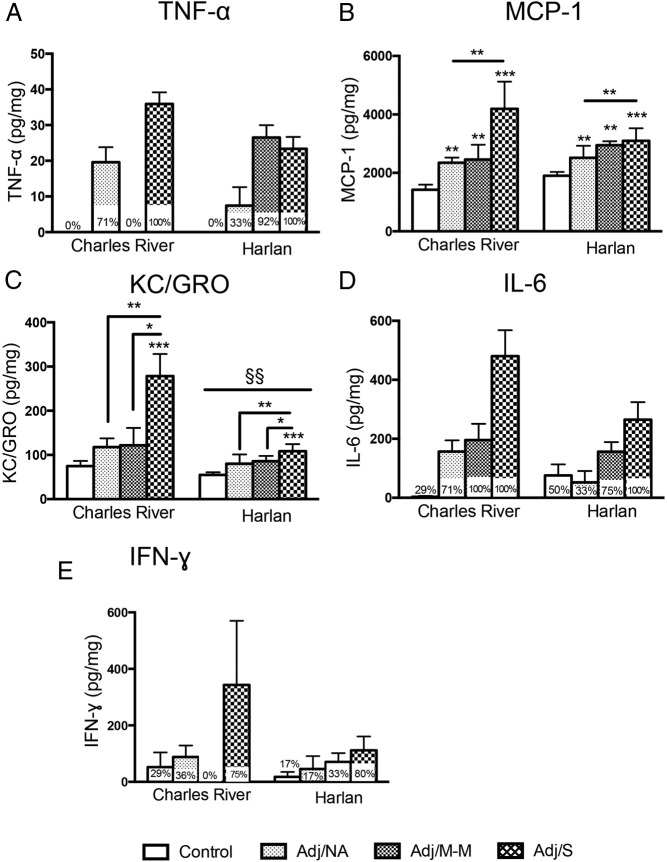
Figure 6.
Levels of cytokines in the plasma at the peak of inflammation (d 16 post-injection). TNF-α (A), IL-6 (D), and IFN-γ (E) generally increased in rats with arthritis but were low or undetectable in most disease states other than severe AA (Adj/S), were not normally distributed, and were not analyzed statistically (percentage of rats with detectable levels within each severity group is indicated on the graph). B, MCP-1 increased with CFA injection in both Charles River and Harlan rats (main effect of AA severity, F [3, 48] = 9.68, P < .001). C, KC/GRO levels only increased with severe AA (main effect of AA severity, F [3, 48] = 6.00, P < .01) and overall were lower in Harlan than Charles River rats (main effect of colony, F [1, 48] = 9.21, P < .01; §§). Note: Lower limits of detection (LLOD) for cytokine assays are as follows: KC/GRO, 3.3 pg/mL; IFN-γ, 104.0 pg/mL; IL-10, 32.2 pg/mL; IL-1β, 23.5 pg/mL; IL-4, 8.26 pg/mL; IL-6, 74.4 pg/mL; MCP-1, 5.27 pg/mL; TNF-α, 12.6 pg/mL. Cytokine levels were Blom transformed for statistical analysis; untransformed data (pg cytokine/ml) are presented in the figure. Data are presented as mean ± SEM. Adj/NA: Charles River: n = 14, Harlan: n = 6; Adj/M-M: Charles River: n = 3, Harlan: n = 12; Adj/S: Charles River: n = 4, Harlan: n = 5; control, saline-injected: Charles River: n = 7, Harlan: n = 6. Post hoc: *, P < .05, **, P < .01, ***, P < .001 (comparison with control, unless indicated otherwise); §§, P < .01, post hoc comparisons between colonies.

