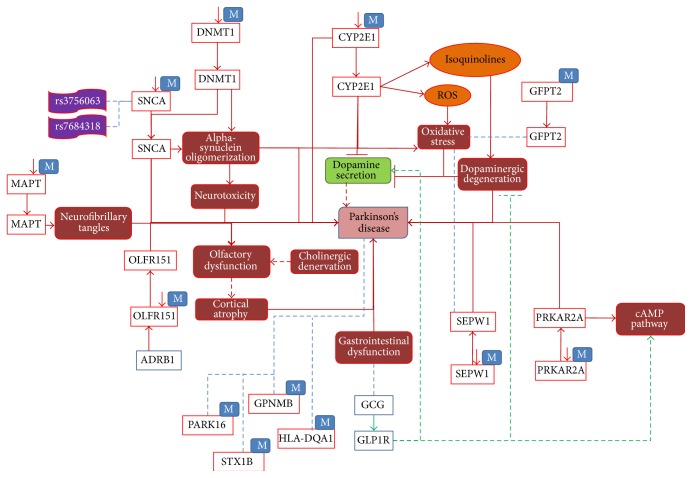
Figure 2.
The role of epigenetics modification; hypomethylation around certain genes in PD. In this figure, red lines indicate the disease state interactions and green lines show normal state. Blue lines show the association between entities with unknown direction. Dotted lines are the interpretation, which needs to be further analysed. “M” associated with a gene entity denotes a methylation process and down-arrows besides represent decreased methylation.

