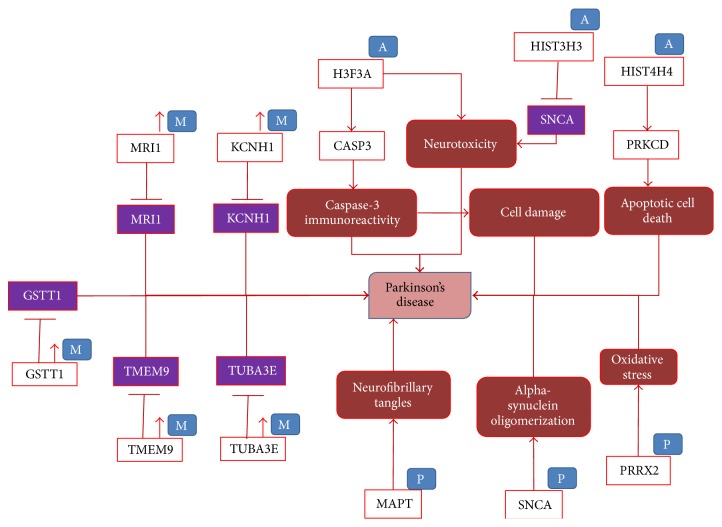
Figure 3.
The role of epigenetics modification, hypermethylation, phosphorylation, and acetylation around certain genes in PD. In this figure also red lines indicate the disease state interactions. “M” associated with a gene entity denotes a methylation process and up-arrows besides represent an increase of methylation. “P” and “A” represent the phosphorylation and acetylation processes, respectively. Genes in purple boxes denote lower expression of genes.

