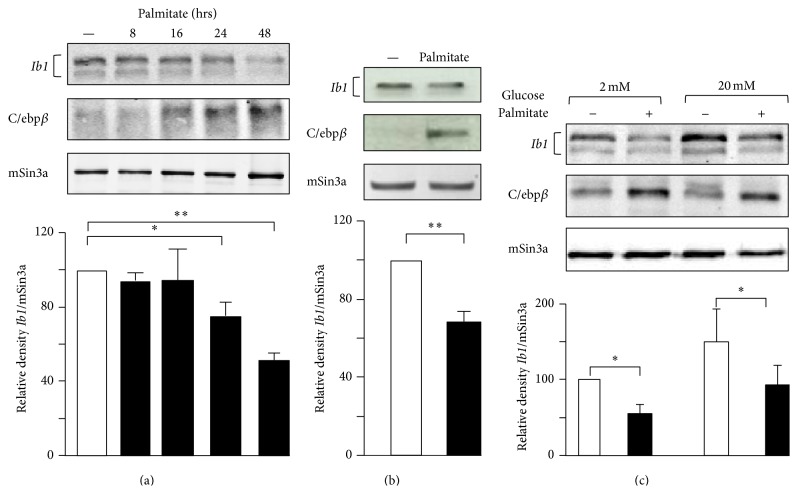
Figure 2.
Effect of palmitate on the Ib1 protein level. Total protein was prepared from (a) MIN6 cells or (b) isolated rat islets that were cultured with 0.5 mM palmitate or BSA (−) at different indicated incubation times and for 24 hrs, respectively or (b) incubated with BSA or palmitate and (c) INS-1E exposed to BSA (−) or 0.5 mM palmitate in the presence of 2 mM or 20 mM glucose. As a positive control for the palmitate efficacy, the expression of C/ebpβ was monitored. Immunoblotting of mSin3a was done as negative control. The Graphs below the blots depict the densitometric analysis. The sum of the Ib1 band intensities of cells treated with BSA was set at 100%. The figure shows the results of a representative experiment out of five. Data are the mean of ± SEM of 3 independent experiments (∗∗ P < 0.01; ∗ P < 0.05).

