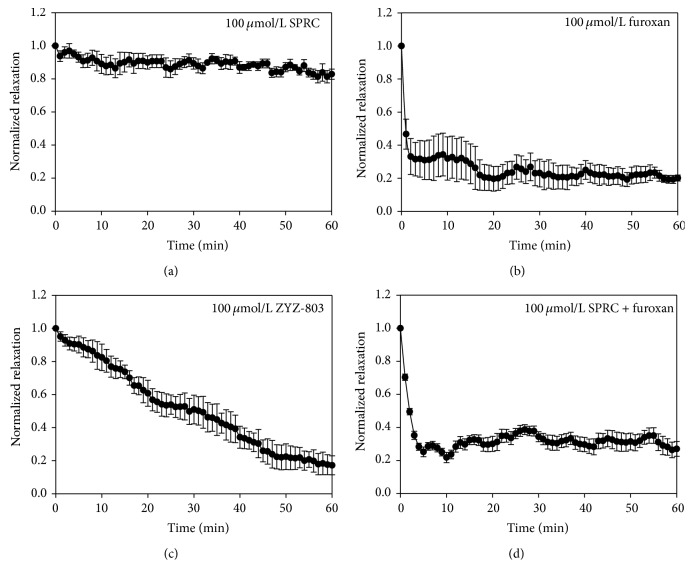
Figure 3.
The time course of vasorelaxant effects of testing compounds in aortic rings on the sustained contraction induced by PE. (a) The vasorelaxation time-effect curve of 100 μmol/L SPRC. (b) The vasorelaxation time-effect curve of 100 μmol/L furoxan. (c) The vasorelaxation time-effect curve of 100 μmol/L ZYZ-803. (d) The vasorelaxation time-effect curve of 100 μmol/L furoxan plus 100 μmol/L SPRC. Data represent mean ± SEM, n ≥ 5 for each group.

