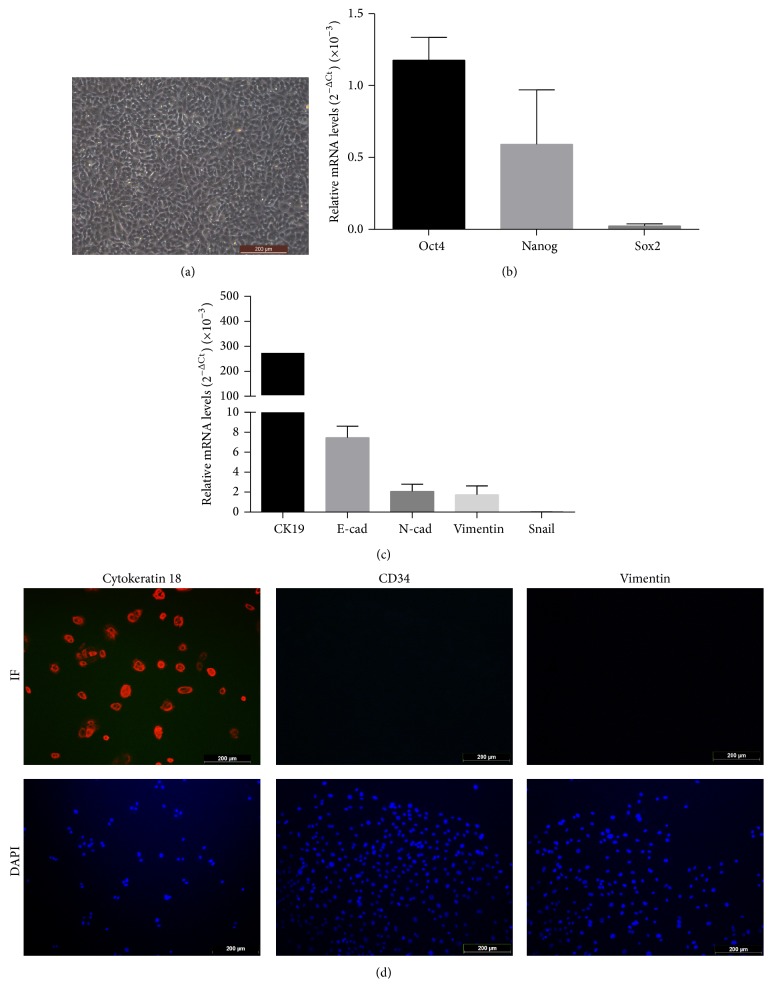
Figure 1.
Identification and characterization of isolated hAECs. (a) The representative characteristics of hAECs under light microscope. (b) Expression of Oct-4, Nanog, and Sox2 (relative to a beta-actin internal control) in cultured hAECs by real-time PCR analysis. The results presented were the average values from five different donors. (c) The analysis of epithelial and mesenchymal markers expression (relative to a beta-actin internal control) in isolated hAECs by real-time PCR. The results presented were the average values from five different donors. (d) Immunofluorescence detection of Cytokeratin 18, CD34, and Vimentin in cultured hAECs. Scale bar: 200 μm.

