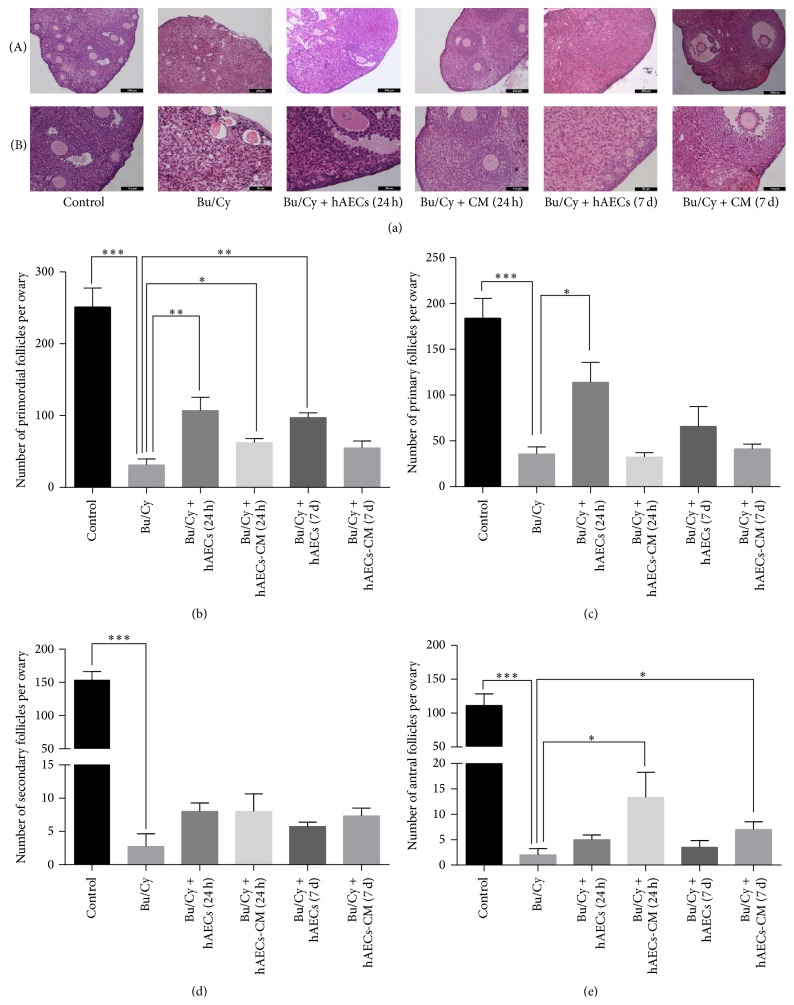
Figure 3.
Histological analysis of mice ovaries and the follicle number count after treatment with hAECs or hAECs-CM. (a) Ovary tissues from each group were stained with hematoxylin and eosin. Numbers of oocyte-containing follicles at all stages were classified and counted in every fifth section. The primordial follicles (b), primary follicles (c), secondary follicles (d), and antral follicles (e) were identified and calculated. Data are shown as mean ± SEM, ∗ P < 0.05, ∗∗ P < 0.01, ∗∗∗ P < 0.001. Scale bar: 200 μm (Panels (a)(A)) and 50 μm (Panels (a)(B)), respectively.

