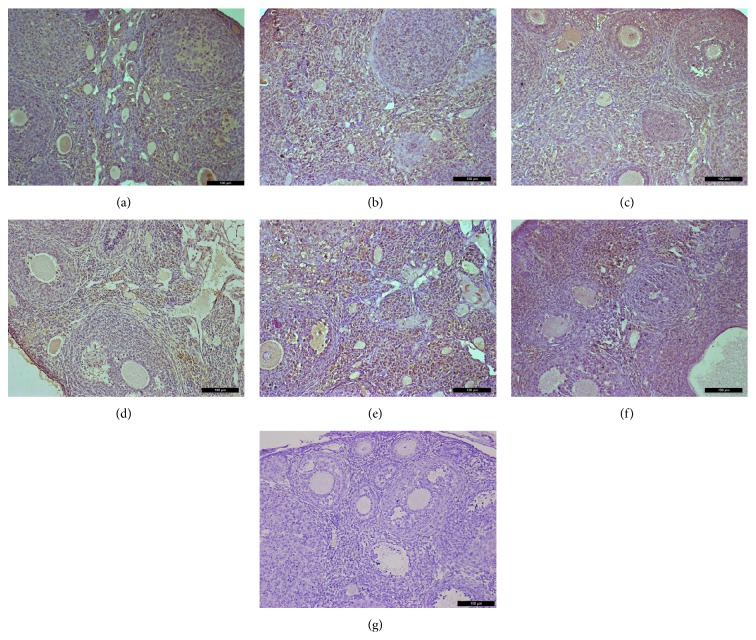
Figure 8.
Immunohistochemical analysis for VEGFA expression in mice ovaries of different groups 2 weeks after treatment; ovarian sections with no primary antibody were served as negative controls. (a) control group; (b) Bu/Cy administrated group; (c) Bu/Cy + hAECs (24 h) group; (d) Bu/Cy + hAECs-CM (24 h) group; (e) Bu/Cy + hAECs (7 d) group; (f) Bu/Cy + hAECs-CM (7 d) group; (g) negative control. Scale bar: 100 μm.

