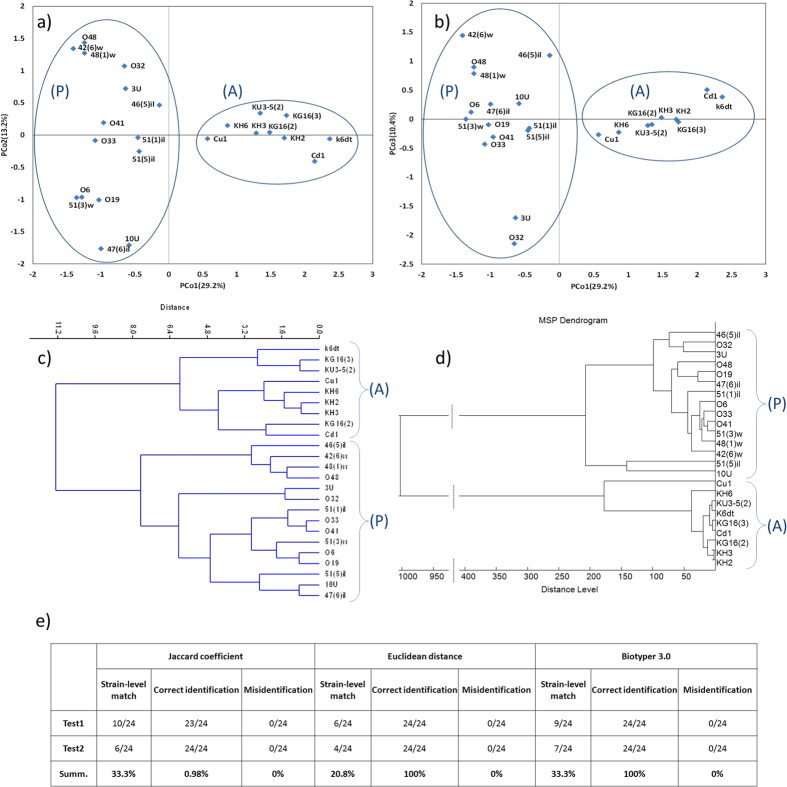
Figure 2. Phyloproteomic analysis.
Position of spectra centroids on the principal coordinates plane: (a) PCo1, PCo2; (b) PCo1, PCo3. The proportions of the total variance for those axes were 29.2% for PCo1, 13.2% for PCo2, and 10.4% for PCo3, which sums up to 52.9%. The groups A and P are framed. Dendrograms constructed based on the distances among spectra centroids by the Ward’s method (c) and by MSPs clustering in Biotyper 3.1 (d). Strains were divided into two clusters that correspond to B. altitudinis (A) and B. pumilus (P); (e) Wet-lab experiment: identification of the studied centroids for two biological replicates using JC, Euclidean distances, and Biotyper 3.1 (cutoff criteria - 2.0, wich is defined Bruker as “secure genus identification, probable species identification”). (e) Wet-lab experiment: identification of the studied centroids for two biological replicates using JC, Euclidean distances, and Biotyper 3.1 (cutoff criteria - 2.0, wich is defined Bruker as “secure genus identification, probable species identification”). Strain-level match - case when centroid of tested specimen and closest centroid in data base belong to the one and the same strain.

