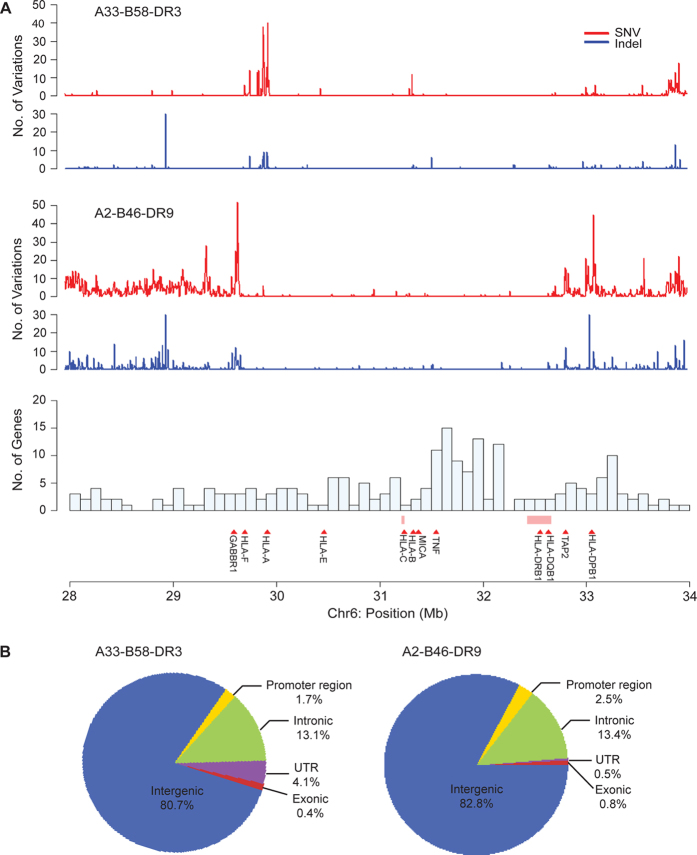
Figure 2. Distribution of intra-CEH variations across the MHC region.
(A) Each data point on the plot represents the number of SNV counts (red) and the number of indel counts (blue) in a non-overlapping 5-kb window. The number of variations for each haplotype was derived from the comparison of six haploid chromosomes at every possible nucleotide position across the MHC region. The pink bars indicate regions where the sequences are ambiguous and nucleotide positions within these regions are not compared. (B) Annotation of intra-CEH variants based on genomic features found in the NCBI RefSeq Build 37.2 gene annotation.

