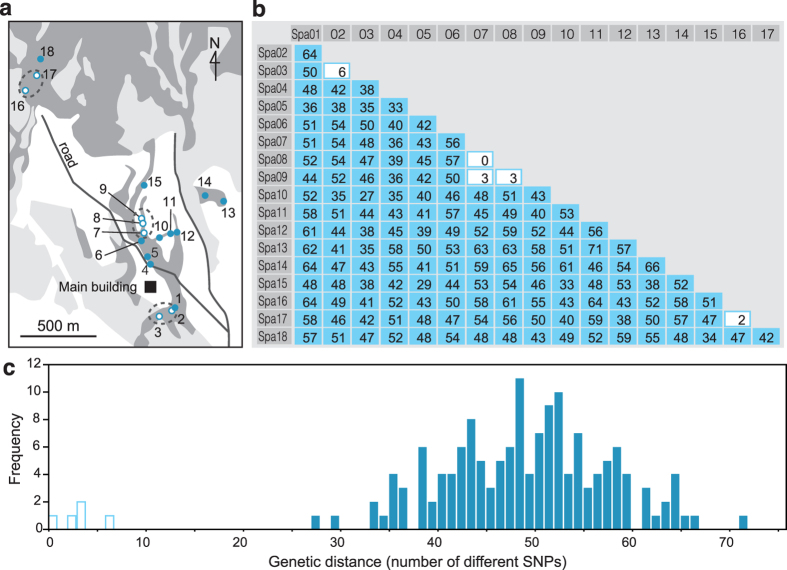
Figure 2. An example of clone identification by MIG-seq analysis.
(a) Spatial distribution of 18 ramets (samples) and three clonal groups (genets, enclosed by dotted line) of Sasa palmata in the Kawatabi Field Science Center, Tohoku University (the main building is indicated on the map), inferred from 144 SNP markers discovered by MIG-seq analysis. Circles indicate the sampling site of each ramet in the distribution area (dark gray) of the species. White and light-gray areas indicate cultivated fields and conifer plantations, respectively. White and blue circles indicate ramets in an inferred clone and ramets from different clones, respectively. The map was generated by YM using Adobe Illustrator CC 2015 version 19.1.0 (Adobe Systems, San Francisco, CA, USA). (b) Matrix of the differences between pairwise numbers of SNPs in the 144 SNP markers among 18 samples of the species. White and blue columns indicate pairs of inferred clones with a small number of different SNPs (0–6) and ramets from different clones with large numbers of different SNPs (27–71), respectively. (c) Histogram showing the frequency distribution of the differences between the pairwise numbers of SNPs in the 144 SNP markers among 18 samples of the species. White and blue bars show the first peak represented by pairs of inferred clones, and the second peak is represented by pairs of ramets from different clones, respectively.

