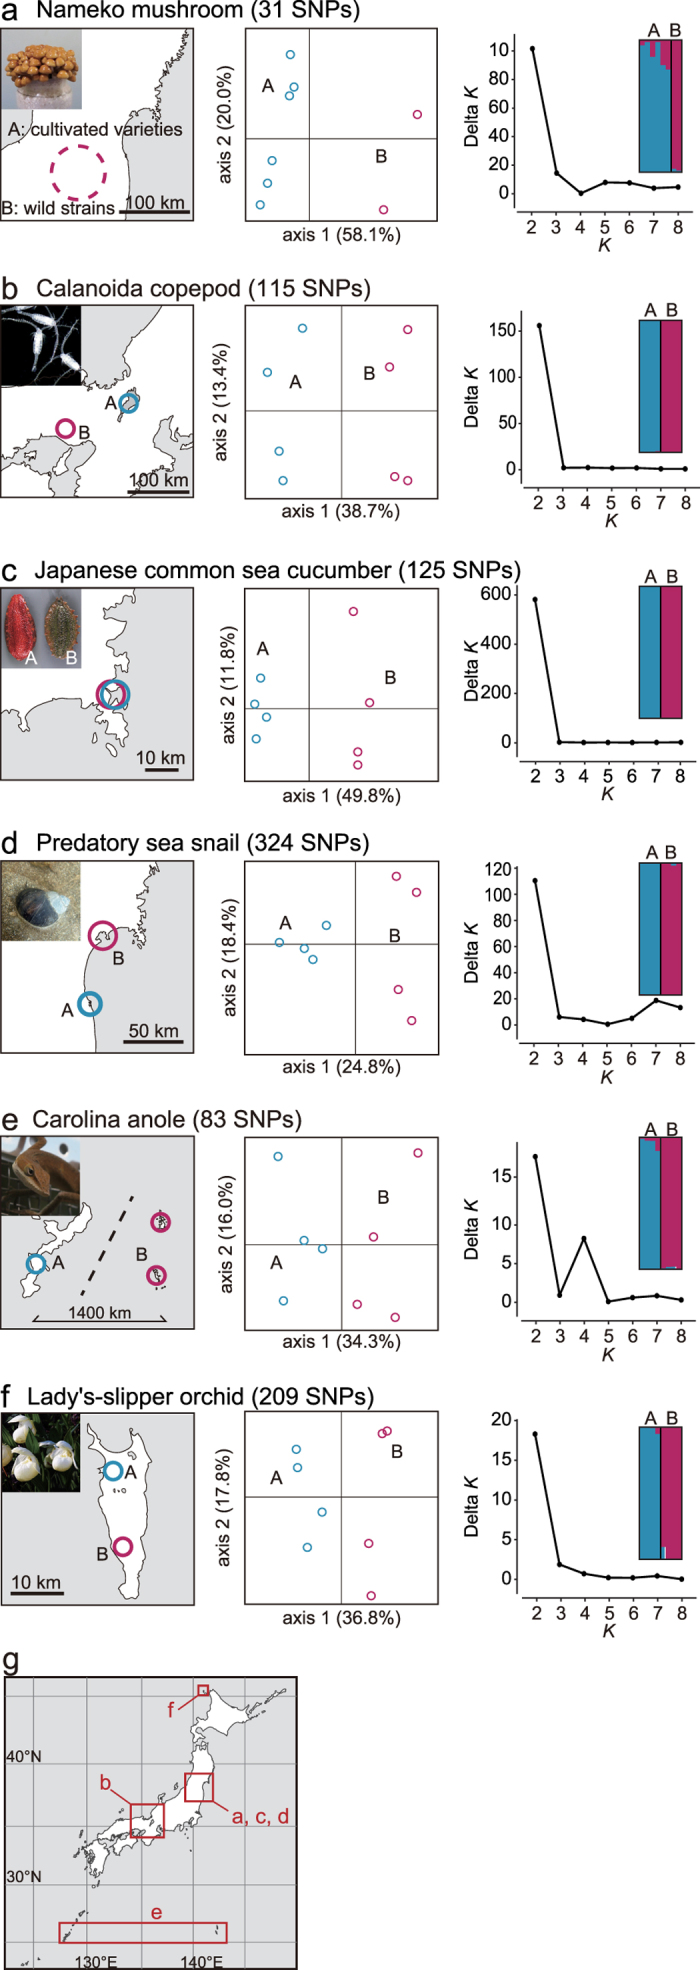
Figure 3.

Examples of population genetic analysis based on MIG-seq for eight samples from two different populations (sources) each of six species: (a) nameko mushroom (Pholiota microspora); (b) Calanoida copepod (Eodiaptomus japonicus); (c) Japanese common sea cucumber (Apostichopus japonicus); (d) predatory sea snail (Laguncula pulchella); (e) Carolina anole (Anolis carolinensis); (f) lady’s-slipper orchid (Cypripedium macranthos var. rebunense). Sampling locations (left), plots of principal coordinate analysis (center), estimation of the optimum number of clusters (K, right), and proportion of the membership coefficient of eight samples in the STRUCTURE analysis (upper right) are shown. (g) Their sampling areas on a large-scale map are also shown. The map was based on the blank map available from Geospatial Information Authority of Japan and modified by YM using Adobe Illustrator CC 2015 version 19.1.0 (Adobe Systems). Photos by Manami Kanno (a,c), Wataru Makino (b), Jotaro Urabe (d), and Yoshihisa Suyama (e,f).
