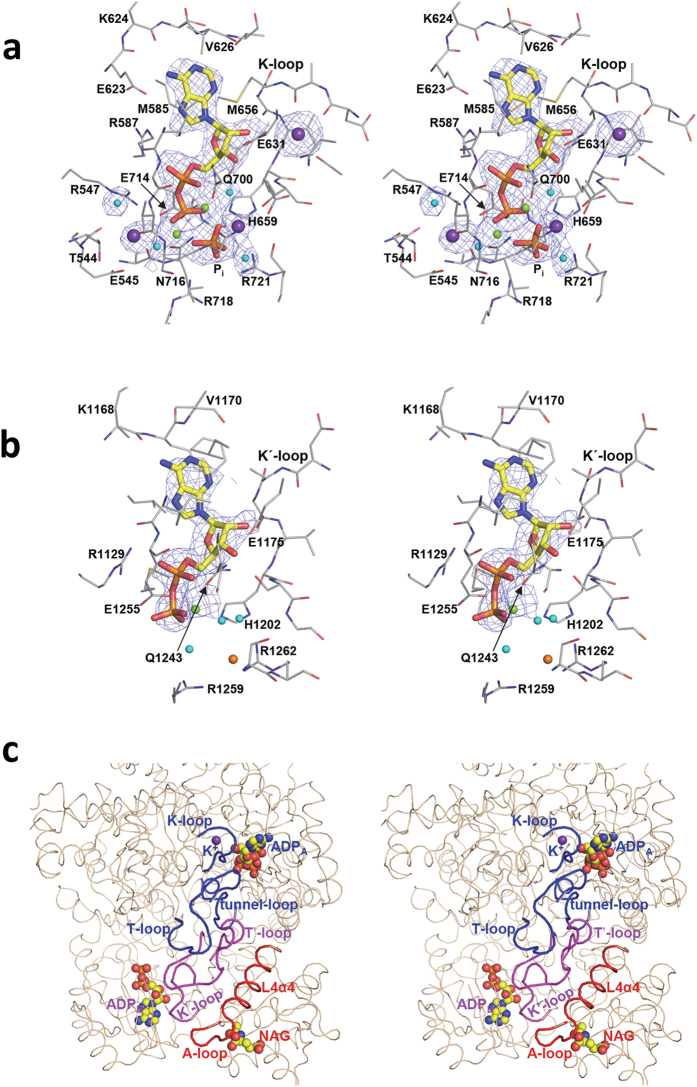
Figure 3. Stereo views of the binding sites for the two molecules of the nucleotide that are used in the reaction, and for the loop system used in signal transmission.
ADP binding in domains L1 (a) and L3 (b). Protein and ADP and phosphate are shown in sticks representation (carbon atoms in grey for the protein and in yellow for the ligands). The lone phosphate is labeled Pi. Potassium, magnesium, chloride ions and water molecules are spheres colored purple, green, orange and cyan, respectively. The (Fo-Fc) electron density maps, computed without the ligands, are shown as a blue grid contoured at 2σ. (c) Close up of the structure of the majority of the C-terminal moiety, to show the binding of both ADP molecules and of NAG and to highlight the relations of helix L4α4 and of the loops more centrally involved in signal transmission. Whereas the overall structure is in brown thin string, the highlighted elements are in thicker string and are labeled, with red, magenta and blue coloring depending on whether they belong to L4, L3 or L1, respectively.

