
Figure 1. Anti-M2AChR antibodies production in immunized animals.
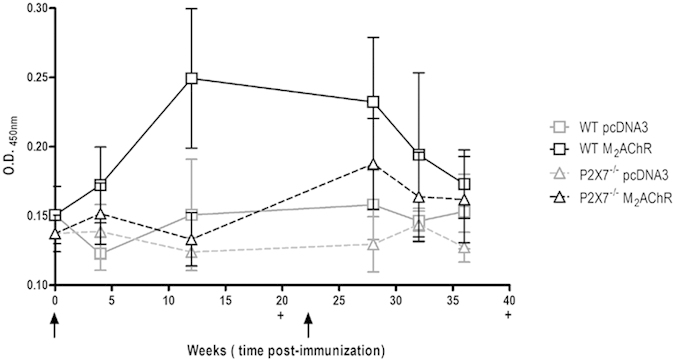
The dosages of anti-M2AChR-el2 IgG antibodies produced by pcDNA3 controls (grey symbols) and pcDNA3-hM2 (black symbols) immunized mice were performed by ELISA. WT animals are represented by full lines and P2×7−/− animals are represented by dashed lines. The values were expressed as the optic density at 450 nm. All analyses were performed in pools of serum from 10 animals. The arrows indicate time of immunization. The data points are presented as the means ± S.E.M from three independent experiments.