
Figure 3. Morphometric analysis of the heart.
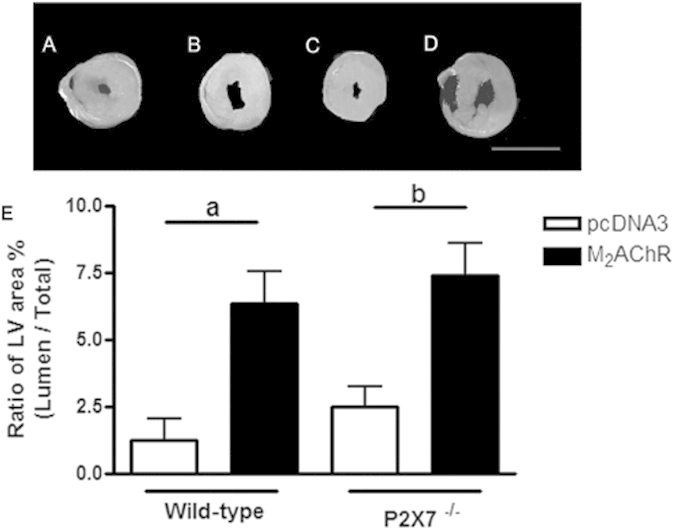
Hearts of WT and P2×7−/− mice, immunized with pcDNA3 or pcDNA3 M2AChR, were collected and analyzed at 40 weeks post-immunization. Upper panel: (A–D) Representative LV myocardial cross section micrographs of hearts from animals of each group at 40 weeks post-immunization. Scale bar, 2 cm. Lower panel: (E) Left Ventricle (LV) area ratio between the area of the cross-section of lumen and the total area of the cross-section of the heart. Black bars represent M2AChR groups and white bars pcDNA3 groups. The letter a indicates a comparison between the WT pcDNA3 and WT M2AChR groups, while letter b indicates a comparison between the P2×7−/− pcDNA3 and P2×7−/− M2AChR groups. N = 5, p < 0.05 was considered statistically significant.