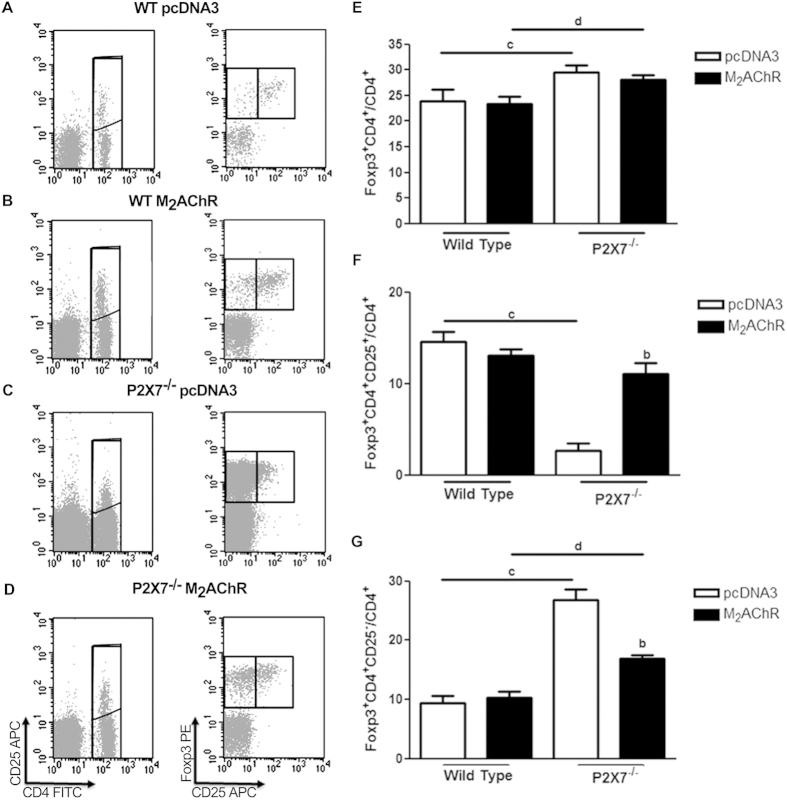
Figure 4. Frequency of CD4+ T lymphocytes and Treg in the spleen of WT and P2×7−/− immunized mice.
Left panel (A–D), representative cytometry data and gate strategy of (A) WT pcDNA3, (B) WT M2AChR, (C) P2×7−/− pcDNA3 and (D) P2×7−/− M2AChR individual mouse spleen cell analyzes. Mean and SD values of the frequency of (E) total CD4+ T cells; (F) total CD4+FoxP3+ Treg among CD4+ T cells and (G) CD4+FoxP3+CD25− Treg subset among CD4+ T cells in each experimental group. Spleens of 5 mice in each group were individually analyzed at day 40 after immunization. Staining was performed as described in the Methods section. The letter b indicates a comparison between the P2×7−/− pcDNA3 and P2×7−/− M2AChR groups. Bars with c indicate the comparison between the WT pcDNA3 and P2×7−/− pcDNA3 groups and with d indicate a comparison between the WT M2AChR and P2×7−/− M2AChR groups. N = 5.

