
Figure 5. IL-1β production in the heart during 40 weeks post-immunization.
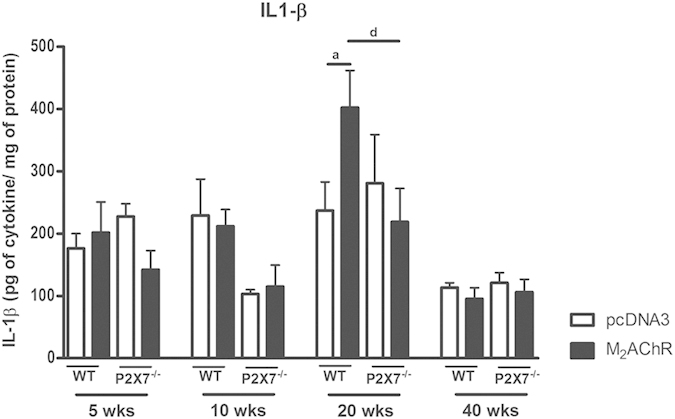
The levels of IL-1β were analyzed directly in heart homogenate without any additional stimulus and expressed as pg of cytokine per mg of total protein at the 5th, 10th, 20th, and 40th weeks post-infection. Black bars represent the M2AChR-immunized groups and white bars represent the pcDNA3-immunized control groups. Bar with a indicates statistically significant differences between WT pcDNA3 and WTM2AChR groups. The letter d indicates a comparison between the WT M2AChR and P2×7−/− M2AChR groups. N = 5, p < 0.05 was considered statistically significant.