
Figure 6. IFNg production in the heart during 40 weeks post-immunization.
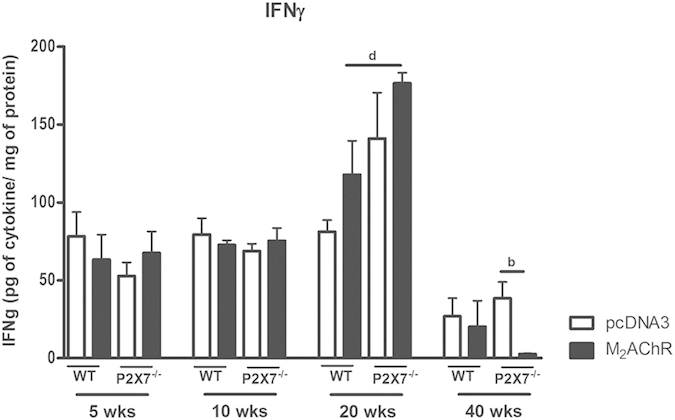
The levels of IFNγ were analyzed using heart homogenate samples. Black bars represent the M2AChR-immunized groups and white bars represent the pcDNA3-immunized control groups. Bar with b indicates statistically significant differences between P2×7−/− pcDNA3 and P2×7−/− M2AChR groups and with d indicates a comparison between the WT M2AChR and P2×7−/− M2AChR groups. N = 5, p < 0.05 was considered statistically significant.