
Figure 7. IL-17 production in the heart during 40 weeks post-immunization.
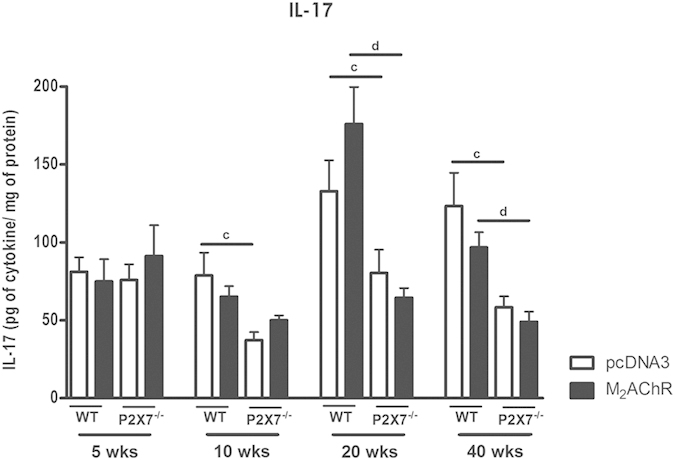
The levels of IL-17 were analyzed using the same protocol as previously described for obtaining the dosage of IL-1b. Black bars represent the M2AChR-immunized groups and white bars represent the pcDNA3-immunized control groups. Bars with c indicate the comparison between the WT pcDNA3 and P2×7−/− pcDNA3 groups and with d indicate a comparison between the WT M2AChR and P2×7−/− M2AChR groups. N = 5, p < 0.05 was considered statistically significant.