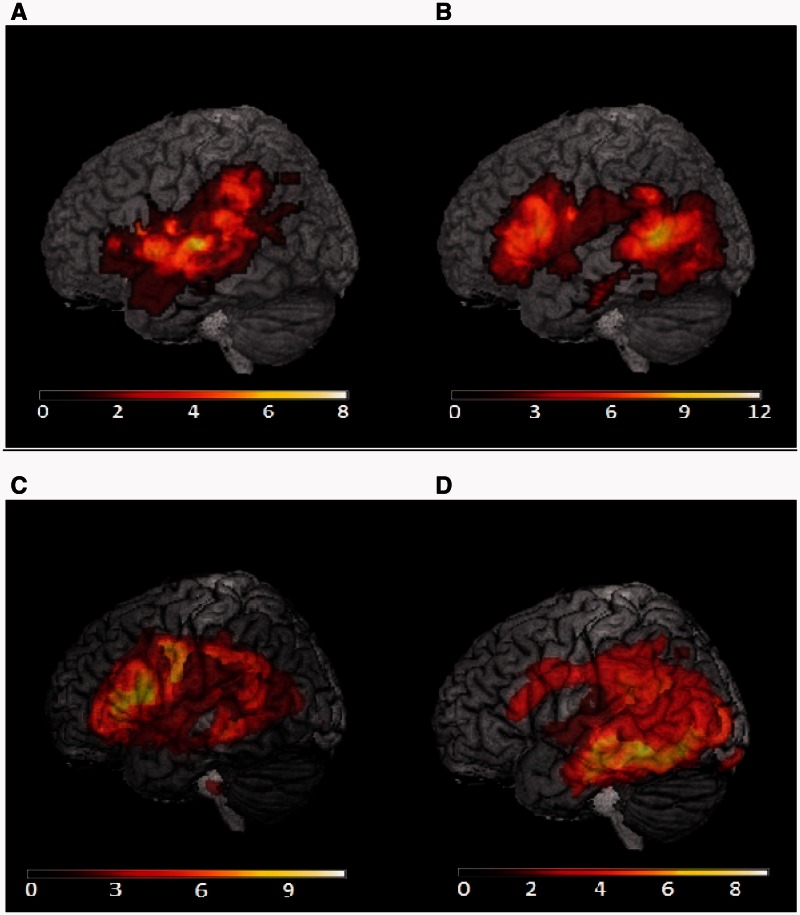
Figure 1.
Lesion overlay map from automatic lesion identification. Lightest colours show areas of maximal overlap between subjects. There were eight patients with Wernicke’s aphasia, and 12 patients with semantic aphasia included in this lesion analysis (shown in A and B; a further semantic aphasia patient was not scanned). In the prefrontal group (C), there were four patients with Wernicke’s aphasia and eight patients with semantic aphasia (one semantic aphasia patient with a prefrontal cortex lesion was not scanned). In the temporoparietal group, there were four patients with Wernicke’s aphasia and five with semantic aphasia (D). To produce these images, the patients’ brains were compared to aged-matched control MRI scans, which were collected at the Universities of Manchester and York. Grey matter, white matter and CSF were segmented and changes from the healthy control brains were highlighted as ‘lesion’ (or more precisely, an unexpected tissue class) using automated methods (Seghier et al., 2008). For the Manchester patients there were 19 controls, with a mean age of 68.2 years [standard deviation (SD) = 5.99; eight female, 11 male]. For the York patients, there were 14 controls, mean age of 64.7 years (SD = 6.5, eight female, six male). The automatic lesion identification algorithm was run separately for Manchester and York cases who were examined using a different MRI scanner. CT scans (Patients MR, BB and KA) were hand-drawn onto a template (Damasio and Damasio, 1989), allowing these patients to be included in these images.

