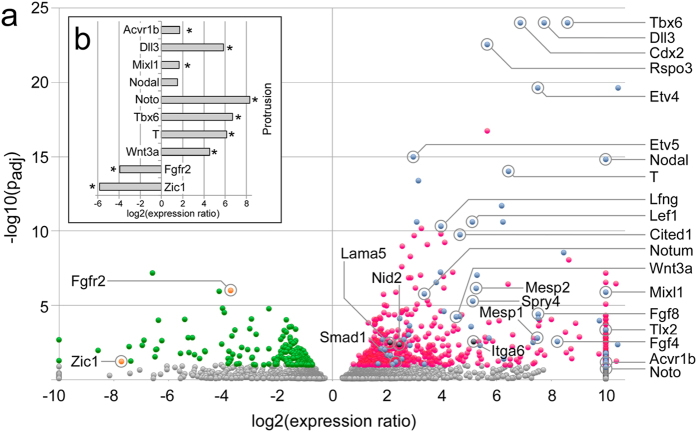
Figure 2. Molecular analysis of neural plate protrusions.
(a) Transcriptome profiling was performed by 3’-expression tag sequencing (SAGE) on an AB SOLiD 5500XL next generation sequencer. Comparisons between 3 individual protrusions (n = 3) and open neural tube neuroepithelium from 4 embryos (n = 4) were done using DESeq. Data are shown as a volcano plot, with statistical significance expressed as –log10(padj) plotted against the expression ratio (protrusion vs. neural tube). Gray color represents genes that did not reach statistical significance (Benjamini-Hochberg correction); red labels genes with expression prevalence in the protrusions; among these genes, blue color indicates genes with a known role in mesoderm development. Green indicates genes with prevalence in the open neural tube, with orange color indicating two genes of interest. Genes where expression was completely absent on one side of the paradigm were plotted at a log2 of either 10 or −10. (b) Validation of the expression difference of selected genes by quantitative real-time PCR. Eight genes with prevalence in protrusions (Acvr1b, Dll3, Mixl1, Nodal, Noto, T, Tbx6, and Wnt3a) were chosen for validation, and two genes (Fgfr2, Zic1) with expression predominant in the open neural tube. The same samples were analyzed from which the sequencing data were derived; thus, we measured gene expression levels in four technical replicates each of three protrusions, and in four technical replicates each of 4 neuroepithelium samples (from 4 individual embryos). Bars represent expression ratio between protrusions and neural tube expressed as log2. Statistical significance in a t-test is indicated by a star symbol. Expression ratios obtained from the sequencing experiment were confirmed for all candidate genes, except for Nodal, which exhibited the expected direction for the expression difference, but did not reach statistical significance.

