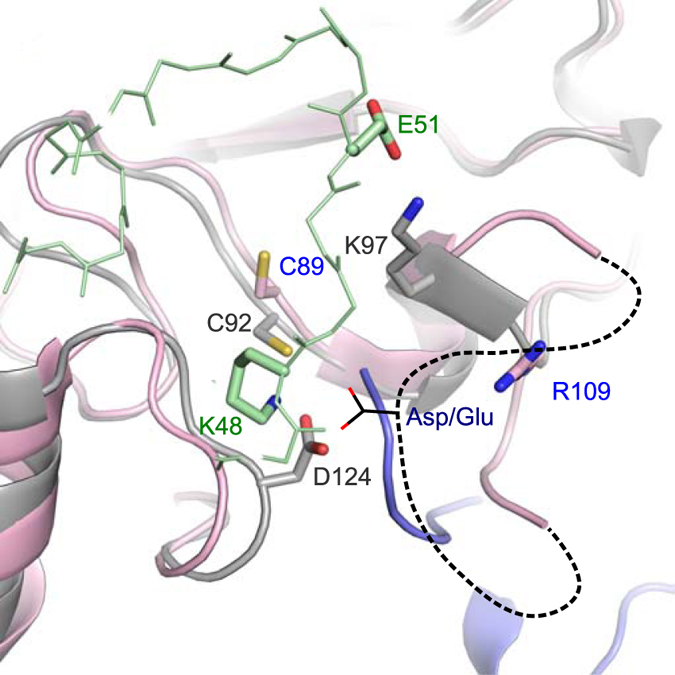
Figure 7. Structural model of UbA on Ube2G2.

Overlay of Ube2K (grey) and Ube2G2 (pink; PDB ID: 4LAD) in the catalytic complex with UbA (green) and UbD (blue). Potential arrangement of the acidic β4α2 insertion in Ube2G is indicated by a dashed line, while the acidic group in this loop is drawn in black.
