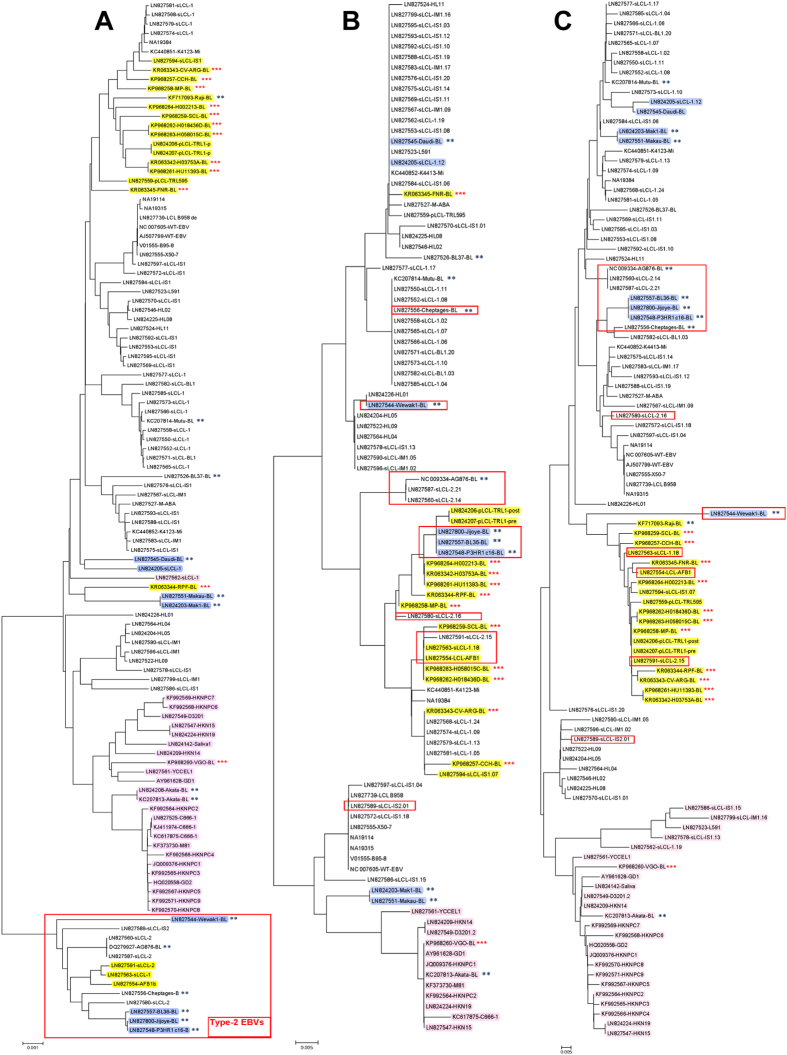
Figure 1. Phylogenetic analysis based on heterogeneity of EBV genome sequences (A), amino acid sequences of EBNA-1 (B) and amino acid sequences of LMP-1 (C).
The 12 BL-EBVs genomes sequenced from BL tumors in our study are marked with three red stars. The 13 BL-EBV genomes previously sequenced from BL cell lines are marked with two blue stars. Type 2 EBVs are boxed in red rectangle(s). EBV genomes are classified into Pattern A (yellow), Pattern B (pink), Pattern C (blue) and Pattern D (no color) for the variations/mutations identified in the promoter region and the N-terminus of LMP-1.

