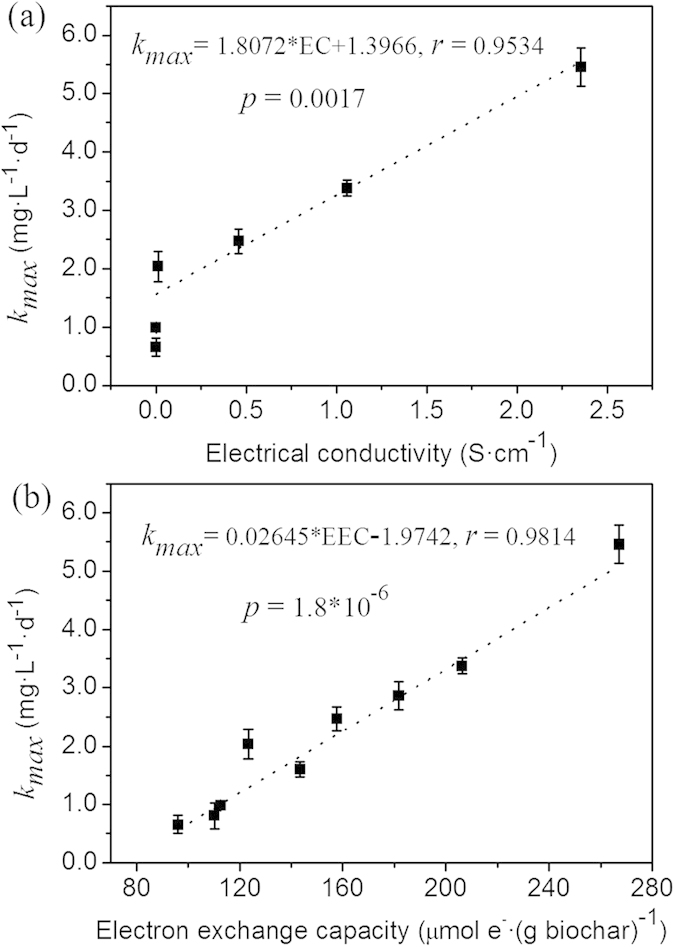
Figure 3.

Correlations between (a) the maximum degradation rates (kmax) and the ECs of biochars, and between (b) the kmax and the EECs of biochars. Dotted lines display the linearly fitted results. Error bars represent ± SD (n = 3).

Correlations between (a) the maximum degradation rates (kmax) and the ECs of biochars, and between (b) the kmax and the EECs of biochars. Dotted lines display the linearly fitted results. Error bars represent ± SD (n = 3).