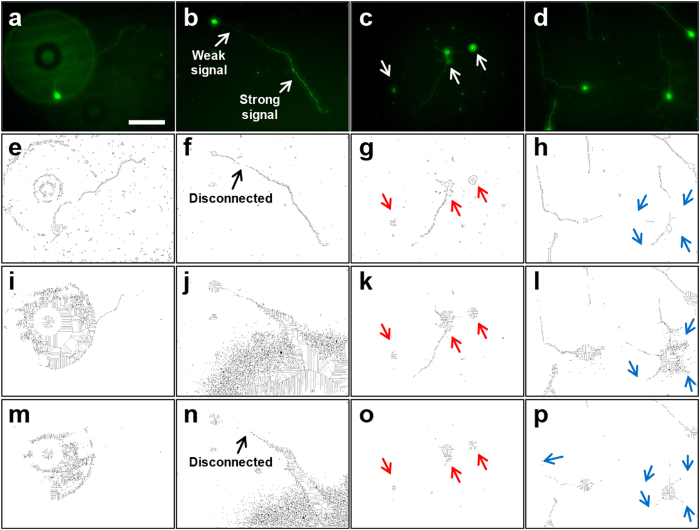
Figure 1.
Challenges to analysis of neuronal structures in images with low SNR. Rows of images: (a–d) Original fluorescent images of neurons analyzed by various methods. (e–h) Edge detection* with manual adjustment of threshold applied to (a–d). (i–l) Skeletonization applied to (a–d) using a low threshold level. (m–p) Skeletonization applied to (a–d) with a high threshold level to remove additional noise. Columns of images: (a,e,i,m) Strong background signal and pixel noise interferes with detection of neuronal structures. Applying a higher threshold to reduce noise (m) results in complete loss of neurite. (b,f,j,n) Inconsistent signal intensity along a neurite leads to a disconnected neurite. (c,g,k,o) False identification of neuronal soma occurs when debris particles are similar in size (indicated by red arrows). (d,h,l,p) Neurites lost or overwhelmed by background noise (indicated by blue arrows). Scale bar = 100 μm. *Edge detection in this study used the Canny operator unless specified otherwise.

