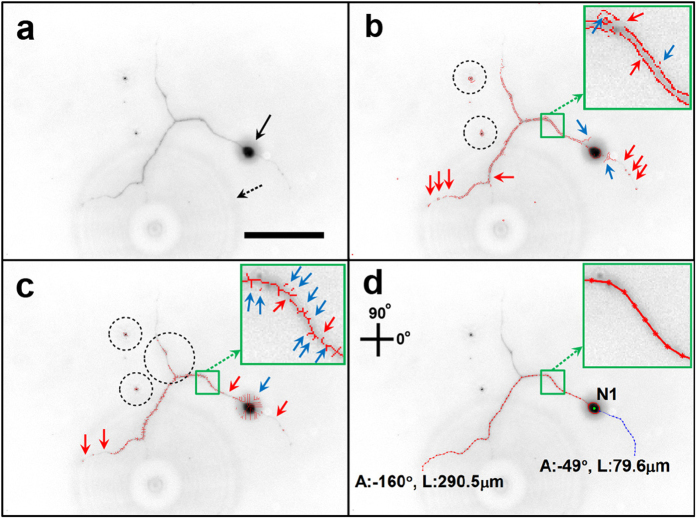
Figure 5. Comparison of neuronal image analysis by different methods.
(a) Image showing a neuron with a low SNR. The noise includes a small halo around the soma (black arrow) and a large halo in the background (dashed arrow). Scale bar = 100 μm. (b) Results from the edge detection method show disconnected neurite structures (red arrows) and spike-like artifact signals around a soma and neurite (blue arrows). In addition, this method generates double stranded structures along the borders of the neurite as shown in the inset, which can multiply the value of neurite length. Non-neuronal particles also are detected (dashed circles). (c) Results from the skeletonization method show disconnected neurite structures (red arrows) and spike-like artifact signals (blue arrows). Additional information such as non-neuronal structures or disconnected branches (dashed circles) interferes with analyzing neuronal structures. Thus, the analysis based on raster representation (b,c) is likely to prevent precise measurement of neurite morphology. (d) Results from NIA method: graphical models used in NIA (i.e, HMM and FCM) enable the analysis based on vector representation where the detected result consists of a sequence of points that are highly relevant to the structure of a neurite. The detected neurite is shown as a single connected line, which prevents the generation of spiky, wavy, and disconnected structures and thus reveals neurite morphology accurately.

