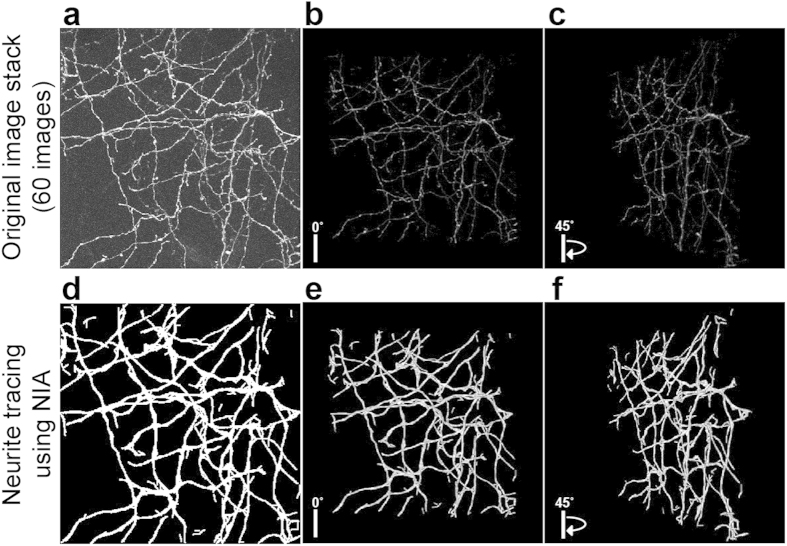
Figure 8. Analysis of stacked images.
(a) A stack of two-photon laser scanning microscopic images (60 images) shows GFP expressing axons from the mouse neocortical layer 122. Stacked images are shown in 3D projection and rotated with (b) 0 and (c) 45 degrees. (d) Neurite tracing of (a) using NIA. Analyzed images are shown in 3D projection and rotated with (e) 0 and (f) 45 degrees. For better visualization of traced neurites, we have thickened the detected neurite structures. Further comparison of 3D projections is shown in Videos 1 and 2 (Supporting information). All processes are fully automated.

